Last Wednesday saw the UK Government’s Spring Statement on the economy: essentially a response to a new forecast from the Office of Budgetary Responsibility. This was politically painful – a deteriorating forecast means that the government needs to either reduce public spending or increase taxes in order for the forecasts to meet its self-imposed constraints on public borrowing and the deficit. Those forecasts are always uncertain, and highly dependent on what assumptions are made about the future. This set of forecasts underline how important productivity growth – or the lack of it – is for the ability of the government to meet its commitments.
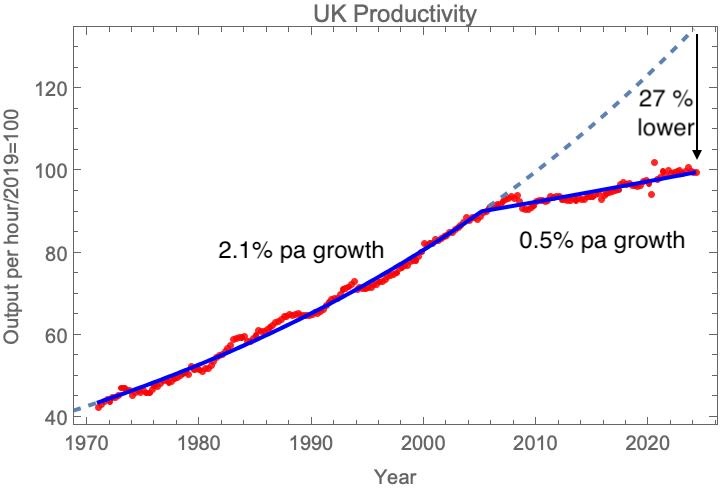
First, where are we now? Here is the latest productivity data. To recap, as I have been discussing for some time now, for much of the postwar period, productivity in the UK grew at a steady rate of 2.1% a year. That changed in the mid-2000s, in the run-up to the global financial crisis; the growth rate rather abruptly dropped to about 0.5% a year. The cumulative effect is that the productivity of the UK economy is now some 28% below what it would have been if earlier trend had continued.

UK Labour Productivity index, quarterly data. The solid blue line is a best fit to a function which assumes two periods of exponential growth continuous at a break point. See my post When did the UK’s productivity slowdown begin? for details of the fitting methodology. The best fit parameters are: pre-break growth rate: 2.1%, post-break growth rate: 0.48%, break at year 2005.2. Data: ONS, Feb 18th 2025 release.
Taking a more close-up look at the last twenty years, one sees that there is no sign of any recovery of productivity growth. On the contrary, the last few quarters seem discouraging. I think it is probably too early to conclude that we are moving into a period of even lower productivity growth – one needs to wait a while to see the long-term trends, and data is often revised. In addition at the moment there is a worry about quality of the survey data ONS uses to estimate total hours worked, which adds further uncertainty.
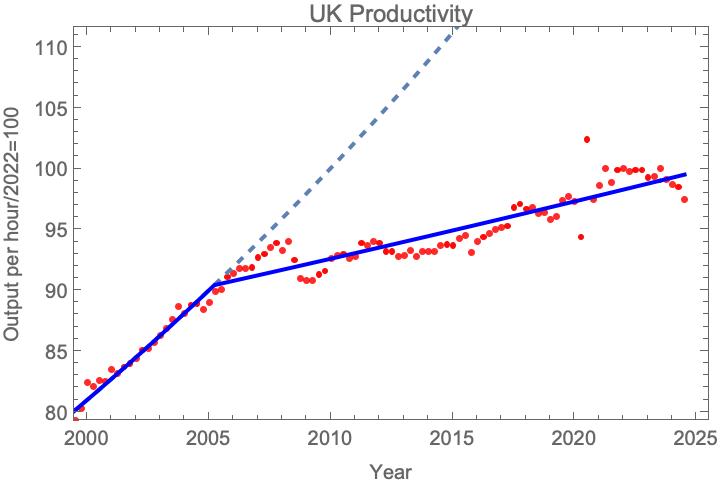
UK Labour Productivity index, quarterly data. Data: ONS, Feb 18th 2025 release, fit as in the plot above.
What is the OBR predicting for the future? It’s central forecast is based on the assumption that productivity growth increases by 2029 to a value which is more or less the average of the pre-break and post-break values – 1.25%, with an increase of 0.2% to the growth rate attributed to planning reforms leading to more house-building. It has also modelled the effect of an upside scenario, where productivity growth of 1.2% is achieved in 2025, and a downside scenario continuing recent lower trend growth of 0.3% a year.

UK Labour Productivity index, annual data, together with the OBR’s March 2025 scenarios for productivity growth up to 2029. Grey is the main March forecast, yellow & green are high and low productivity growth scenarios.
The next plot, from the OBR report, shows how much difference assumptions about productivity growth make to the fiscal projections. Without the assumption that productivity growth is about to increase significantly over the trend it’s followed for the last 15 years, the government’s fiscal targets for the debt and the deficit can’t be met. In this scenario, the government would need either to cut public spending further or increase taxes to meet those targets.
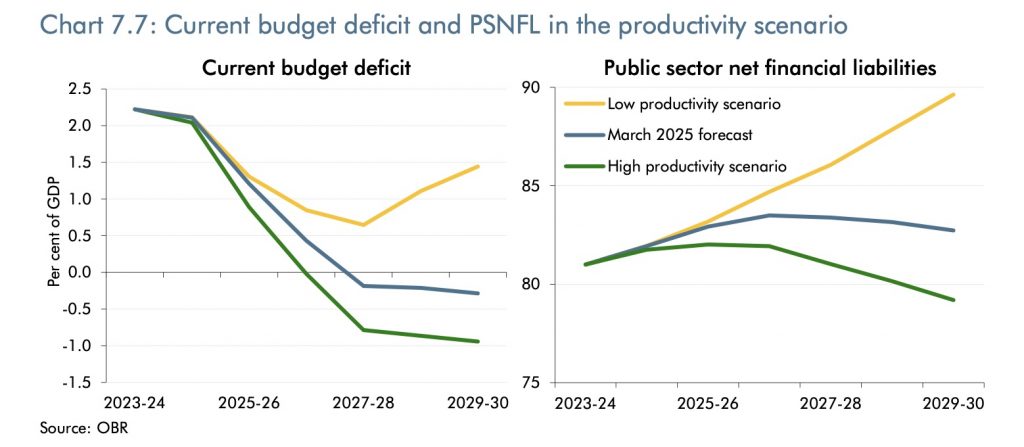
Effect of the different productivity growth scenarios on the OBRs fiscal forecasts. From the March 2025 Economic and Fiscal Outlook.
So, big decisions about the UK’s fiscal policy are being made on the basis of predictions of future productivity growth, and the question of whether the government will meet its fiscal targets are very sensitive to the assumptions being made. How much credence can we place on these forecasts? It does have to be stressed that the OBRs record on predicting productivity growth has been consistently overoptimistic since its establishment, as the plot below shows. I think this reflects a wider failure by the UK’s economic and policy-making community to appreciate the scale of the change to the UK economy in the 1990s and 2000s and its long term effects. There is no more important economic policy question than to understand the causes of the productivity slowdown – and to find policies to reverse this.

Successive OBR forecasts of productivity and outturn. Source: OBR