The UK is now well into a second decade of sluggish productivity growth, with far-reaching consequences for people’s standard of living, for the sustainability of public services, and (arguably) for the wider political environment. It has become usual to date the beginning of this new period of slow productivity growth to the global financial crisis around 2008, but I increasingly suspect that the roots of the malaise were already in place earlier in the 2000s.
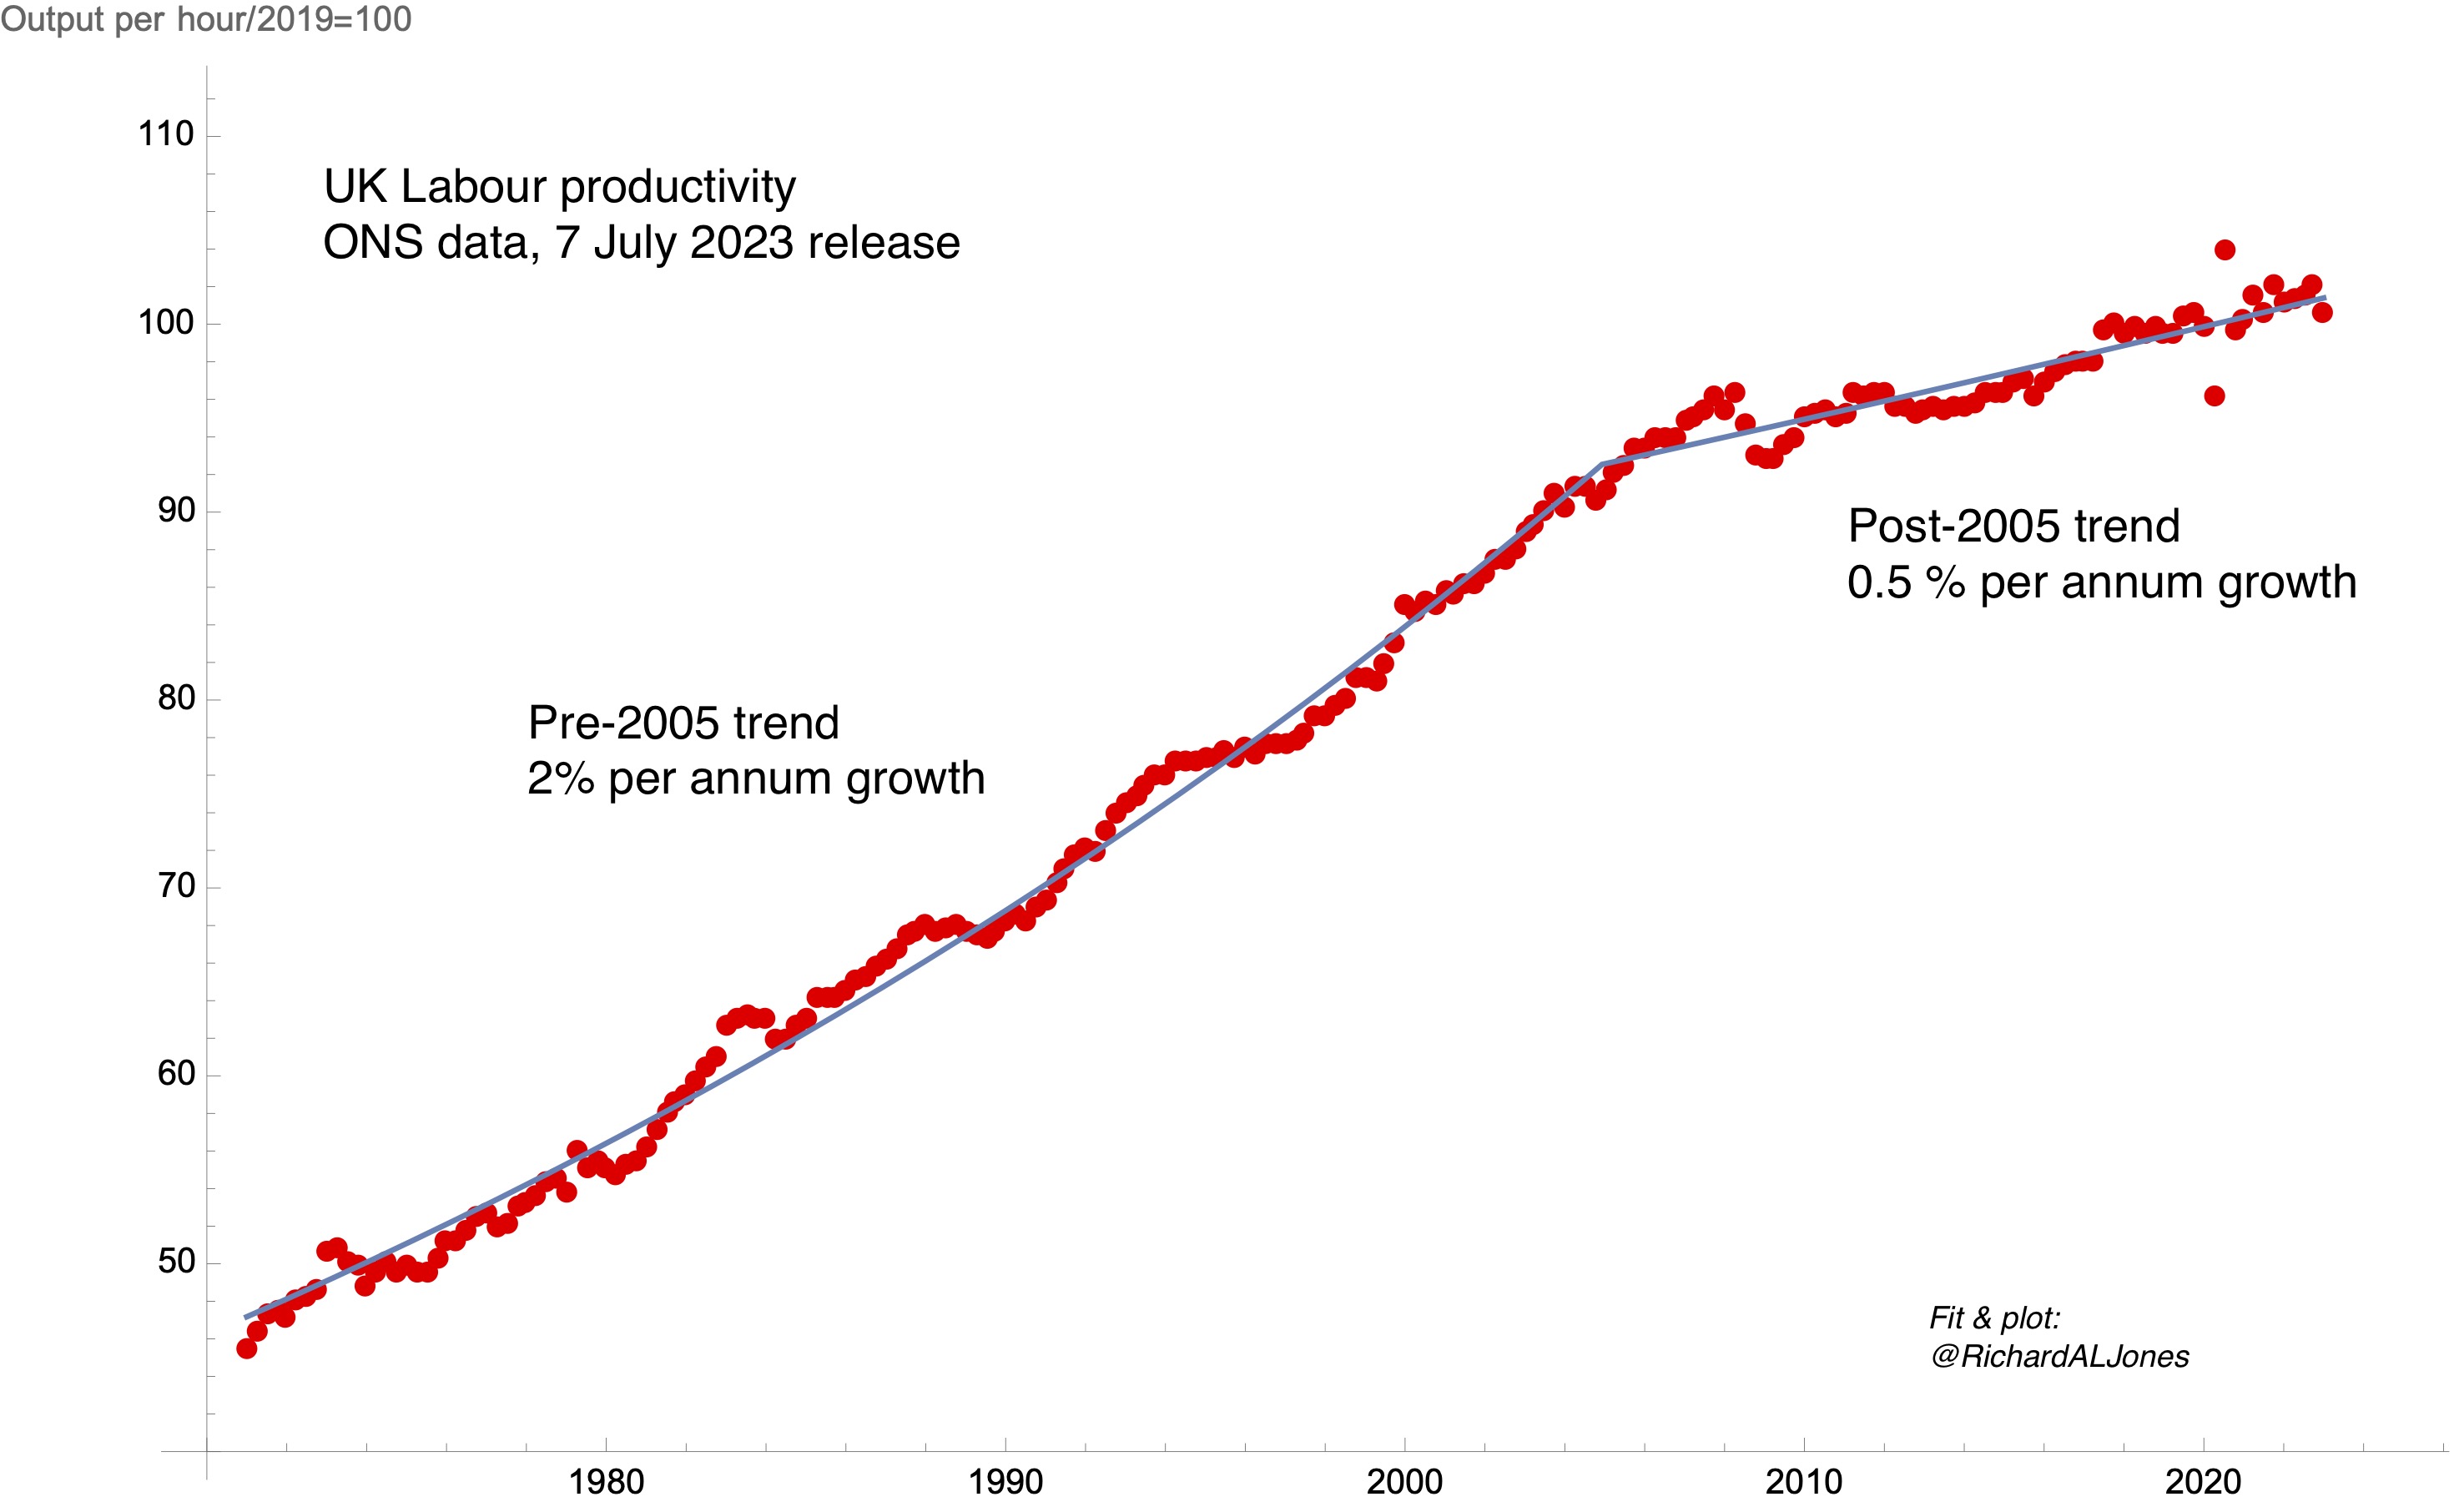
UK Labour productivity. Data: ONS, Output per hour worked, chained volume measure, 7 July 2023 release. Fit: non-linear least squares fit to two exponential growth functions, continuous at break point. Best fit break point is 2004.9.
My plot shows the latest release of whole-economy quarterly productivity data from the ONS. I have fitted the data to a function representing two periods of exponential growth, with different time constants, constrained to be continuous at a time of break. There are four fitting parameters in this function – the two time constants, the level at the break point, and the time of break. My best fit shows a break point at 2004.9.
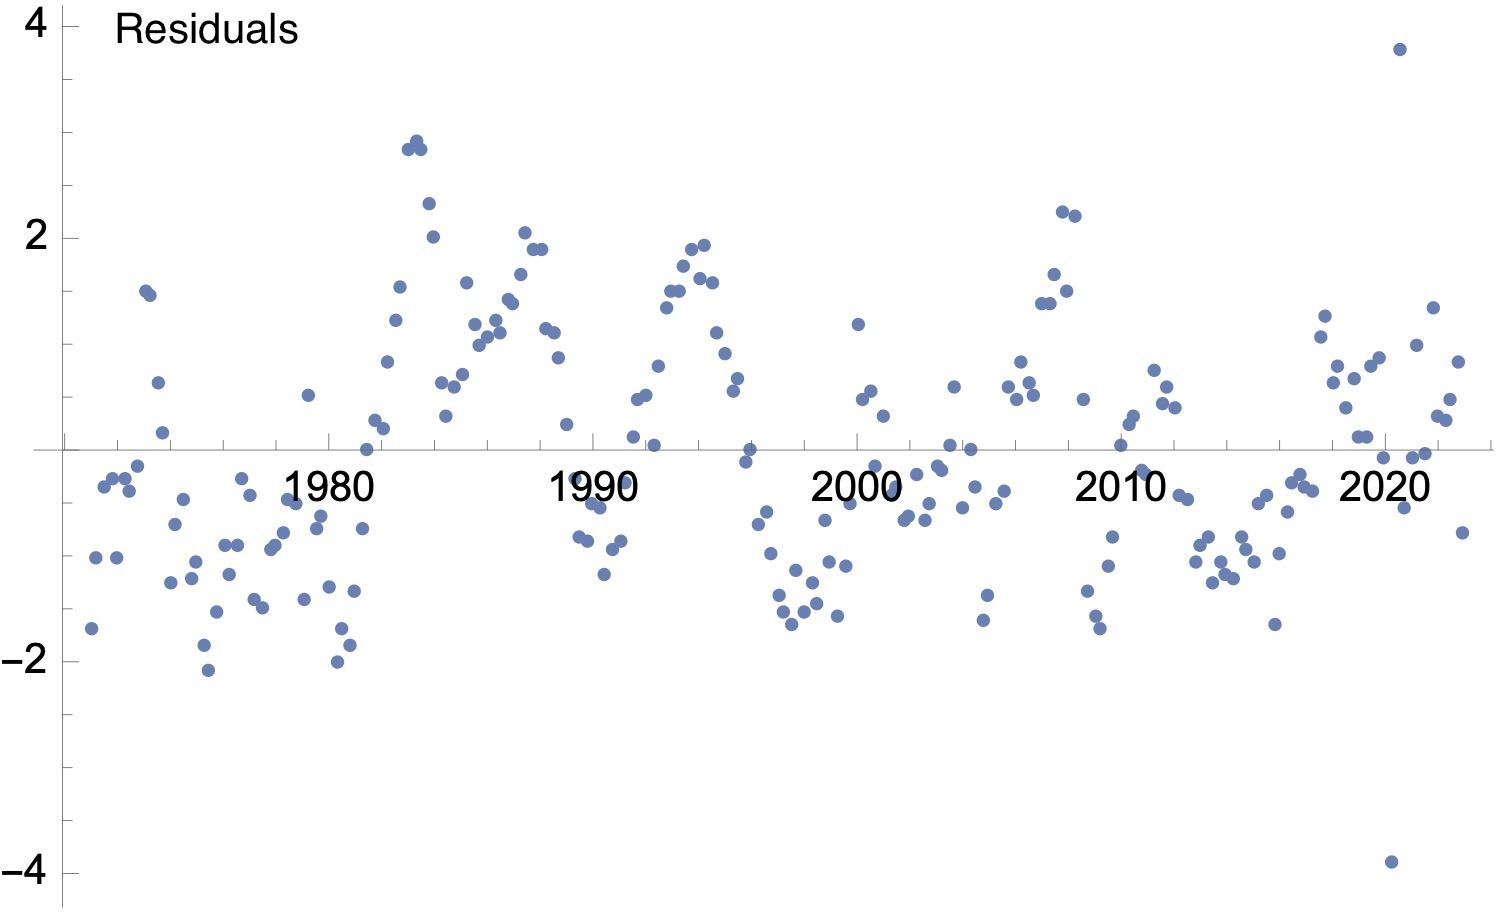
Residuals for the fit to the quarterly productivity data shown above.
The plot of the residuals to the fit is shown above. This shows that the goodness of fit is comparable across the whole time range (with the exception of the spikes representing the effect of the pandemic). There are deviations from the fit corresponding to the effect of booms and recessions, but the deviations around the time of the Global financial crisis are comparable with those in earlier boom/bust cycles.
How sensitive is the fit to the timing of the break point? I’ve redone the fits constraining the year of the break point, and calculated at each point the normalised chi-squares (i.e. the sum of the squared differences between data and model, divided by the number of data points). This is shown below.
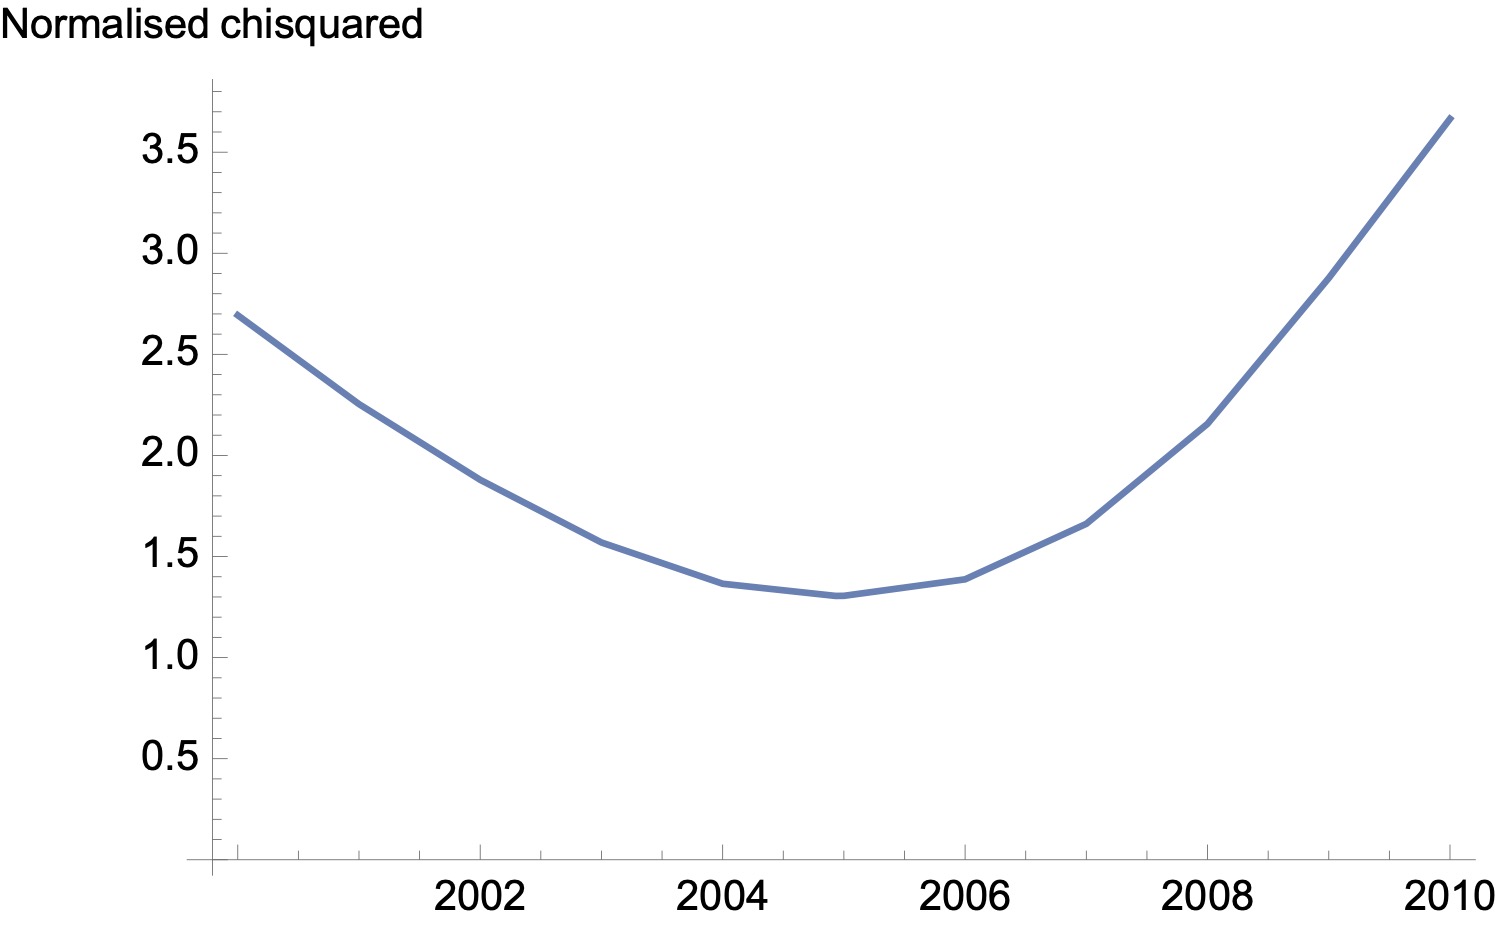
Normalised chi-squared – i.e. sum of the squares of the differences between productivity data and the two exponential model, for fits where the time of break is constrained.
The goodness of fit varies smoothly around an optimum value of the time of break near 2005. A time of break at 2008 produces a materially worse quality of fit.
Can we quantify this further and attach a probability distribution to the year of break? I don’t think so using this approach – we have no reason to suppose that the deviations between model and fit are drawn from a Gaussian, which would be the assumption underlying traditional approaches to ascribing confidence limits to the fitting parameters. I believe there are Bayesian approaches to addressing this problem, and I will look into those for further work.
But for now, this leaves us with a hypothesis that the character of the UK economy, and the global context in which it operated, had already made the transition to a low productivity growth state by the mid-2000’s. In this view, the financial crisis was a symptom, not a cause, of the productivity slowdown.
Interesting post (as always).
I’ve not done the modelling on fake data to check, but if there were a drop in productivity (i.e. a step down) at the GFC wouldn’t you expect two linear fits without a drop to shift the crossover point earlier? Might not be a big effect but worth checking perhaps.