Climate change: what do we know for sure, and what is less certain?

In another post inspired by my current first year physics course, The Physics of Sustainable Energy (PHY123), I suggest how a physicist might think about climate change.

The question of climate change is going up the political agenda again; in the UK recent floods have once again raised the question of whether recent extreme weather can be directly attributed to human-created climate change, or whether such events are likely to be more frequent in the future as a result of continuing human induced global warming. One UK Energy Minister – Michael Fallon – described the climate change argument as “theology” in this interview. Of course, theology is exactly what it’s not. It’s science, based on theory, observation and modelling; some of the issues are very well understood, and some remain more uncertain. There’s an enormous amount of material in the 1536 pages of the IPCC’s 5th assessment report (available here). But how should we navigate these very complex arguments in a way which makes clear what we know for sure, and what remains uncertain? Here’s my suggestion for a route-map.

My last post talked about how, after 1750 or so, we became dependent on fossil fuels. Since that time we have collectively burned about 375 gigatonnes of carbon – what has the effect of burning all that carbon been on the environment? The straightforward answer to that is that there is now a lot more carbon dioxide in the atmosphere than there was in pre-industrial times. For the thousand years before the industrial revolution, the carbon dioxide content of the atmosphere was roughly constant at around 280 parts per million. Since the 19th century it has been significantly increasing; it’s currently just a couple of ppm short of 400, and is still increasing by about 2 ppm per year.

This 40% increase in carbon dioxide concentration is not in doubt. But how can we be sure it’s associated with burning fossil fuels? Continue reading “Climate change: what do we know for sure, and what is less certain?”

How did we come to depend so much on fossil fuels?

This is another post inspired by my current first year physics course, The Physics of Sustainable Energy (PHY123).

Each inhabitant of the UK is responsible for consuming, on average, the energy equivalent of 3.36 tonnes of oil every year. 88% of this energy is in the form of fossil fuels (about 35% each for gas and oil, and the rest in coal). This dependence on fossil fuels is something new; premodern economies were powered entirely by the sun. Heat came from firewood, which stores the solar energy collected by photosynthesis for at most a few seasons. Work was done by humans themselves, again using energy that ultimately comes from plant foods, or by draught animals. The transition from traditional, solar powered economies, to modern fossil fuel powered economies, was sudden in historical terms – it was probably not until the late 19th century that fossil fuels overtook biomass as the world’s biggest source of energy. The story of how we came to depend on fossil fuels is essentially the story of how modernity developed.

The relatively late date of the world’s transition to a fossil fuel based energy economy doesn’t mean that there were no innovations in the way energy was used in premodern times. On the contrary, the run-up to the industrial revolution saw a series of developments that greatly increased the accessibility of energy. Continue reading “How did we come to depend so much on fossil fuels?”

Understanding the energy debate

This semester I teach an optional course to first year physics students at the University of Sheffield, with Professor David Lidzey, called The Physics of Sustainable Energy (PHY123). This post explains why I think the course is important and some of what we hope to achieve in it.

The prosperous industrial society we live in depends, above all, on access to cheap and plentiful energy. Our prosperity has grown as our consumption of those concentrated energy sources that fossil fuels provide has multiplied. But this dependency is a problem for us; burning all those fossil fuels has materially altered the atmosphere, this has changed the world’s climate and this climate change is set to continue and intensify. We need to put our energy economy onto a more sustainable basis, but at the moment this transition seems a long way away, and the energy debate doesn’t seem to be progressing very fast. The aim of our course is to give physics students some of the tools needed to understand and contribute to that debate.

So what do you need to know to understand the energy debate? Continue reading “Understanding the energy debate”

The UK’s nuclear new build: too expensive, too late

Seven years after a change in UK energy policy called for a new generation of nuclear power stations to be built, today’s announcement of a deal with the French energy company EDF to build two nuclear power plants at Hinckley point marks a long overdue step forward. But the deal is a spectacularly bad one for the UK. It locks us into high energy prices for a generation, it yields an unacceptable degree of control over a strategic asset to a foreign government, it risks sacrificing the opportunity nuclear new build might have given us to rebuild our industrial base, and it will cost us tens of billions of pounds more than necessary. It’s all to preserve political appearances, to allow the government to appear to be abiding by its unwisely made commitments.

The UK is committed to privatised energy markets, no subsidies for nuclear power, and is unwilling to issue new government debt to pay for infrastructure. An opposition to state involvement in energy seems to apply only to the UK state, though, as this deal demonstrates. EDF is majority owned by the French Government, while the Chinese nuclear companies China General Nuclear and China National Nuclear Corporation, who will be co-investing in the project, are wholly owned and controlled by the Chinese government. The price of this investment (as reported by the FT’s Nick Butler) is some as yet unspecified degree of operational involvement. It seems extraordinary that the government is prepared to allow such a degree of involvement in a strategic asset by the agents of a foreign state.

The deal will not, it’s true, be directly subsidised by the UK government (except, and not insignificantly, for an implicit subsidy in the form of a disaster insurance guarantee). Instead future electricity consumers will pay the subsidy, in the form of a price guarantee set at around twice the current wholesale price of electricity, to rise with inflation over 35 years.

The quoted price for two European Pressurised Water Reactors of 1.6 GWe capacity is £16 billion. The first of this reactor design to be built, at Olkiluoto in Finland, started out with a price of €3 billion, but after delays and overruns the current estimate is €8.5 billion. So the quoted price for two of £16 billion – €9.45 billion – bakes in this cost overrun and adds a little bit more for luck. How much of this £16 billion will come back to the UK in the form of jobs and work for UK industry? It is difficult to say, because no commitments seem to have been made that a certain fraction of work should come to the UK. Given the fact that the UK government isn’t paying for the reactors, it doesn’t have a lot of leverage on this.

How bad a deal is this in monetary terms? The strike price is £92.50 per MWh, falling to £89.50 if EDF goes ahead with another pair of reactors at Sizewell, fully inflation indexed to the consumer price index. A recent OECD report (PDF) gives some idea of costs; for reactors of this type operating in France it estimates fuel cycle costs as $9.33 per MWh, operations and maintenance at $16 per MWh, with $0.05 per MWh needed to be set aside to cover the final costs of decommissioning. Taking these together this comes to a little less than £16 per MWh. This leaves £76.50 per MWh to cover the cost of capital of the £16 billion it takes to build it. Assuming EDF manage to run their 3.2 MW of capacity at a 90% load factor, this gives them and their investors £1.9 billion a year, or a total return of £67 billion, fully protected against inflation, for their £16 billion investment.

How much would it cost if the UK government itself decided that it should invest in the plant? The UK government can currently borrow money for 30-40 years at 3.5%. The fully amortised loan for £16 billion over 35 years would cost £28 billion. Unlike the deal agreed with EDF and the Chinese, these borrowing costs would not rise with inflation. Even without accounting for inflation, the UK Government’s ideological opposition to borrowing money to pay for infrastructure carries a price tag of around £40 billion, that will have to be paid by UK industry and consumers over the next 35 years.

I do think we need a new generation of nuclear power stations in the UK, but this model for achieving that seems unsustainable. It’s time for a complete rethink. For more background on why we are where we are, see my last post, Moving beyond nuclear power’s troubled history.

Update at 8.40am 21/10: the Energy Minister, Ed Davey, said on Radio 4 this morning that there was a commitment for 57% of the value of the deal to be spent with UK firms. This isn’t mentioned in the press release.

Update 2, 22/20: The CEO of EDF was reported yesterday as saying that 57% involvement of UK firms wasn’t a commitment, but an upper limit. So I think my original comments stand.

We sold out our energy future

Everyone should know that the industrial society we live in depends on access to plentiful, convenient, cheap energy – the last two hundred years of rapid economic growth has been underpinned by the large scale use of fossil fuels. And everyone should know that the effect of burning those fossil fuels has been to markedly increase the carbon dioxide content of the atmosphere, resulting in a changing climate, with potentially dangerous but still uncertain consequences. But a transition from fossil fuels to low carbon sources of energy isn’t going to take place quickly; existing low carbon energy sources are expensive and difficult to scale up. So rather than pushing on with the politically difficult, slow and expensive business of deploying current low carbon energy sources, why don’t we wait until technology brings us a new generation of cheaper and more scalable low carbon energy? Presumably, one might think, since we’ve known about these issues for some time, we’ve been spending the last twenty years energetically doing research into new energy technologies?

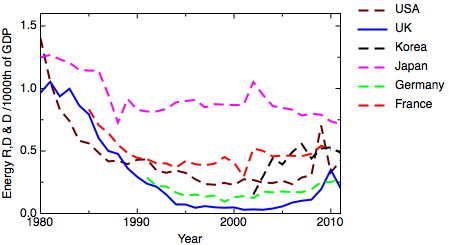
Alas, no. As my graph shows, the decade from 1980 saw a worldwide decline in the fraction of GDP major industrial countries devoted to government funded energy research, development, and demonstration, with only Japan sustaining anything like its earlier intensity of energy research into the 1990s. It was only in the second half of the decade after 2000 that we began to see a recovery, though in the UK and the USA a rapid upturn following the 2007 financial crisis has fallen away again. A rapid post-2000 growth of energy RD&D in Korea is an exception to the general picture. There’s a good discussion of the situation in the USA in a paper by Kamman and Nemet – Reversing the incredible shrinking energy R&D budget. But the largest fall by far was in the UK, where at its low point, the fraction of national resource devoted to energy RD&D fell, in 2003, to an astonishing 0.2% of its value at the 1981 high point.

Government spending on energy research, development and demonstration
Government spending on energy research, development and demonstration. Data: International Energy Authority

Continue reading “We sold out our energy future”

Can plastic solar cells deliver?

The promise of polymer solar cells is that they will be cheap enough and produced on a large enough scale to transform our energy economy, unlocking the sun’s potential to meet all our energy needs in a sustainable way. But there’s a long way to go from a device in a laboratory, or even a company’s demonstrator product, to an economically viable product that can be made at scale. How big is that gap, are there insuperable obstacles standing in the way, and if not, how long might it take us to get there? Some answers to these questions are now beginning to emerge, and I’m cautiously optimistic. Although most attention is focused on efficiency, the biggest outstanding technical issue is to prolong the lifetime of the solar cells. But before plastic solar cells can be introduced on a mass scale, it’s going to be necessary to find a substitute for indium tin oxide as a transparent electrode. But if we can do this, the way is open for a real transformation of our energy system.

The obstacles are both technical and economic – but of course it doesn’t make sense to consider these separately, since it is technical improvements that will make the economics look better. A recent study starts to break down the likely costs and identify where we need to find improvements. The paper – Economic assessment of solar electricity production from organic-based photovoltaic modules in a domestic environment, by Brian Azzopardi, from Manchester University, with coworkers from Imperial College, Cartagena, and Riso (Energy and Environmental Science 4 p3741, 2011) – breaks down an estimate of the cost of power generated by a polymer photovoltaic fabricated on a plastic substrate by a manufacturing process already at the prototype stage. This process uses the most common combination of materials – the polymer P3HT together with the fullerene derivative PCBM. The so-called “levelised power cost” – i.e. the cost per unit of electricity, including all capital costs, averaged over the lifetime of the plant, comes in between €0.19 and €0.50 per kWh for 7% efficient solar cells with a lifetime of 5 years, assuming southern European sunshine. This is, of course, too expensive both compared to alternatives like fossil fuel or nuclear energy, and to conventional solar cells, though the gap with conventional solar isn’t massive. But the technology is still immature, so what improvements in performance and reductions in cost is it reasonable to expect?

The two key technical parameters are efficiency and lifetime. Most research effort so far has concentrated on improving efficiencies – values greater than 4% are now routine for the P3HT/PCBM system; a newer system, involving a different fullerene derivative, PC70BM blended with the polymer PCDTBT (I find even the acronym difficult to remember, but for the record the full name is poly[9’-hepta-decanyl-2,7- carbazole-alt-5,5-(4’,7’-di-2-thienyl-2’,1’,3’-benzothiadiazole)]), achieves efficiencies greater than 6%. These values will improve, through further tweaking of the materials and processes. Azzopardi’s analysis suggests that efficiencies in the range 7-10% may already be looking viable… as long as the cells last long enough. This is potentially a problem – it’s been understood for a while that the lifetime of polymer solar cells may well prove to be their undoing. The active materials in polymer solar cells – conjugated polymer semiconductors – are essentially overgrown dyes, and we all know that dyes tend to bleach in the sun. Five years seems to be a minimum lifetime to make this a viable technology, but up to now many laboratory devices have struggled to last more than a few days. Another recent paper, however, gives grounds for more optimism. This paper – High Efficiency Polymer Solar Cells with Long Operating Lifetimes, Advanced Energy Materials 1 p491, 2011), from the Stanford group of Michael McGehee – demonstrates a PCDTBT/PC70BM solar cell with a lifetime of nearly seven years. This doesn’t mean all our problems are solved, though – this device was encapsulated in glass, rather than printed on a flexible plastic sheet. Glass is much better than plastics at keeping harmful oxygen away from the active materials; to reproduce this lifetime in an all-plastic device will need more work to improve the oxygen barrier properties of the module.

How does the cost of a plastic solar cell break down, and what reductions is it realistic to expect? The analysis by Azzopardi and coworkers shows that the cost of the system is dominated by the cost of the modules, and the cost of the modules is dominated by the cost of the materials. The other elements of the system cost will probably continue to decrease anyway, as much of this is shared in common with other types of solar cells. What we don’t know yet is the extent to which the special advantages of plastic solar cells over conventional ones – their lightness and flexibility – can reduce the installation costs. As we’ve been expecting, the cheapness of processing plastic solar cells means that manufacturing costs – including the capital costs of the equipment to make them – are small compared to the cost of materials. The cost of these materials make up 60-80% of the cost of the modules. Part of this is simply the cost of the semiconducting polymers; these will certainly reduce with time as experience grows at making them at scale. But the surprise for me is the importance of the cost of the substrate, or more accurately the cost of the thin, transparent conducting electrode which coats the substrate – this represents up to half of the total cost of materials. This is going to be a real barrier to the large scale uptake of this technology.

The transparent electrode currently used is a thin layer of indium tin oxide – ITO. This is a very widely used material in touch screens and liquid crystal displays, and it currently represents the major use of the metal indium, which is rare and expensive. So unless a replacement for ITO can be found, it’s the cost and availability of this material that’s going to limit the use of plastic solar cells. Transparency and electrical conductivity don’t usually go together, so it’s not straightforward to find a substitute. Carbon nanotubes, and more recently graphene, have been suggested, but currently they’re neither good enough by themselves, nor is there a process to make them cheaply at scale (a good summary of the current contenders can be found in Rational Design of Hybrid Graphene Films for High-Performance Transparent Electrodes by Zhu et al, ACS Nano 5 p6472, 2011). So, to make this technology work, much more effort needs to be put into finding a substitute for ITO.
Energy, carbon, money – floating rates of exchange

When one starts reading about the future of the world’s energy economy, one needs to get used to making conversions amongst a zoo of energy units – exajoules, millions of tons of oil equivalent, quadrillions of british thermal units and the rest. But these conversions are trivial in comparison to a couple of other rates of exchange – the relationship between energy and carbon emissions (using this term as a shorthand for the effect of energy use on the global climate), and the conversion between energy and money.

On the face of it, it’s easy to see the link between emissions and energy. You burn a tonne of coal, you get 29 GJ of energy out and you emit 2.6 tonnes of carbon dioxide. But, if we step back to the level of a national or global economy, the emissions per unit of energy used depend on the form in which the energy is used (directly burning natural gas vs using electricity, for example) and, for the case of electricity, on the mix of generation being used. But if we want an accurate picture of the impact of our energy use on climate change, we need to look at more than just carbon dioxide emissions. CO2 is not the only greenhouse gas; methane, for example, despite being emitted in much smaller quantities than CO2, is still a significant contributor to climate change as it is a considerably more potent greenhouse gas than CO2. So if you’re considering the total contribution to global warming of electricity derived from a gas power station you need to account, not just for the CO2 produced by direct burning, but of the effect of any methane emitted from leaks in the pipes getting to the power station. Likewise, the effect on climate of the high altitude emissions from aircraft is substantially greater than that from the carbon dioxide alone, for example due to the production of high altitude ozone from NOx emissions. All of these factors can be wrapped up by expressing the effect of emissions on the climate through a measure of “mass of carbon dioxide equivalent”. It’s important to take these additional factors into account, or you end up significantly underestimating the climate impact of much energy use, but this accounting embodies more theory and more assumptions.

For a high accessible and readable account of the complexities of assigning carbon footprints to all sorts of goods and activities, I recommend Mike Berners-Lee’s new book How Bad Are Bananas?: The carbon footprint of everything. This has some interesting conclusions – his insistence on full accounting leads to surprisingly high carbon footprints for rice and cheese, for example (as the title hints, he recommends you eat more bananas). But carbon accounting is in its infancy; what’s arguably most important now is money.

At first sight, the conversion between energy and money is completely straightforward; we have well-functioning markets for common energy carriers like oil and gas, and everyone’s electricity bill makes it clear how much we’re paying individually. The problem is that it isn’t enough to know what the cost of energy is now; if you’re deciding whether to build a nuclear power station or to install photovoltaic panels on your roof, to make a rational economic decision you need to know what the price of energy is going to be over a twenty to thirty year timescale, at least (the oldest running nuclear power reactor in the UK was opened in 1968).

The record of forecasting energy prices and demand is frankly dismal. Vaclav Smil devotes a whole chapter of his book Energy at the Crossroads: Global Perspectives and Uncertainties to this problem – the chapter is called, simply, “Against Forecasting”. Here are a few graphs of my own to make the point – these are taken from the US Energy Information Administration‘s predictions of future oil prices.

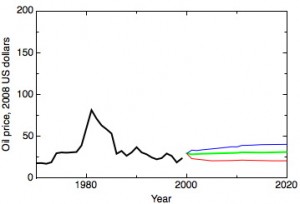
In 2000 the USA’s Energy Information Agency produced this forecast for oil prices (from the International Energy Outlook 2000):

Historical oil prices up to 2000 in 2008 US dollars, with high, low and reference predictions made by the EIA in 2000

After a decade of relatively stable oil prices (solid black line), the EIA has relatively tight bounds between its high (blue line), low (red line) and reference (green line) predictions. Let’s see how this compared with what happened as the decade unfolded:

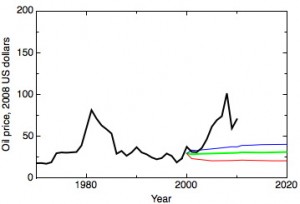
High, low and reference predictions for oil prices made by the EIA in 2000, compared with the actual outcome from 2000-2010

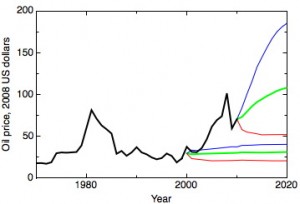
The EIA, having been mugged by reality in its 2000 forecasts, seems to have learnt from its experience, if the range of the predictions made in 2010 is anything to go by:

2000 and 2010 oIl price predictions
Successive predictions for future oil prices made by the USA's EIA in 2000 and 2010, compared to the actual outcome up to 2010

This forecast may be more prudent than the 2000 forecast, but with a variation of nearly of factor of four between high and low scenarios, it’s also pretty much completely useless. Conventional wisdom in recent years argues that we should arrange our energy needs through a deregulated market. It’s difficult to see how this can work when the information on the timescale needed to make sensible investment decisions is so poor.