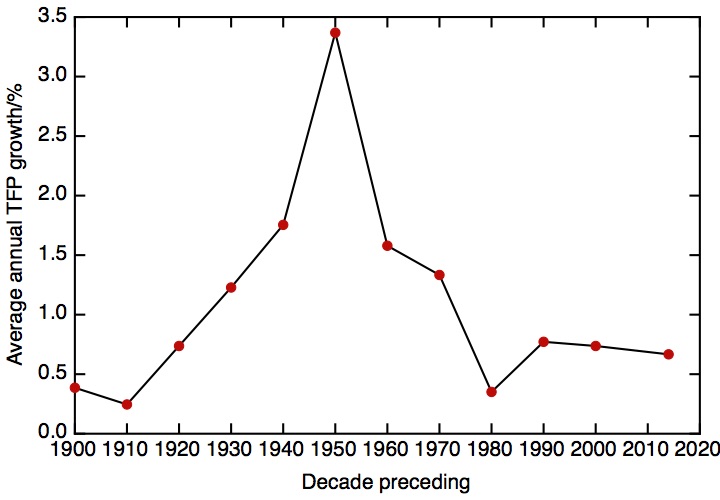
Robert Gordon’s book “The Rise and Fall of American Growth” comprehensively describes the fall in productivity growth in the USA from its mid-twentieth century highs, as I discussed in my last post. Given the book’s exclusive focus on the USA, it’s interesting to set this in a more international context by looking at the data for other developed countries.
My first graph shows the labour productivity – defined as GDP per hour worked – for the G7 group of developed nations since 1970. This data, from the OECD, has been converted into constant US dollars at purchasing power parity; one should be aware that these currency conversions are not completely straightforward. Nonetheless, the picture is very clear. On this semi-logarithmic plot, a constant annual growth rate will produce a straight line. Instead, what we see is a systematic slow-down in the growth rate as we go from 1970 to the present day. I have fitted the data to a logistic function, which is a good representation of growth that starts out exponential and starts to saturate. In 1970, labour productivity in the G7 nations was growing at around 2.9% annually, but by the present day this had dropped to an annual growth rate of 1.2%.
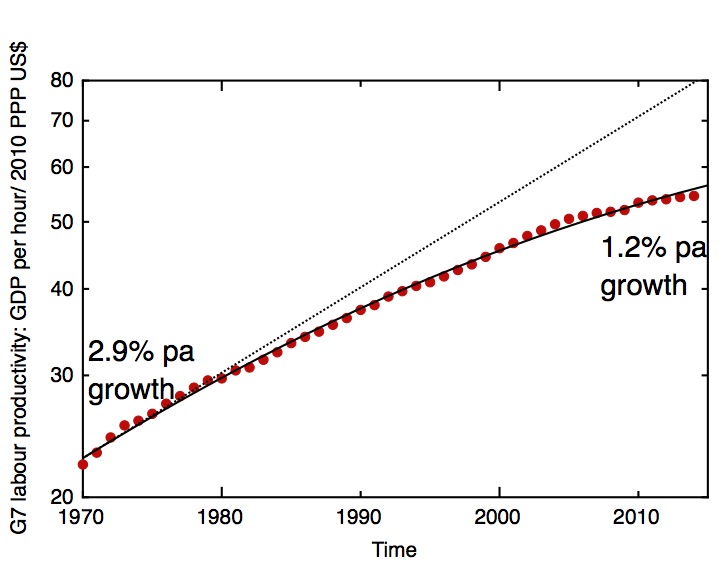
Labour productivity across the G7 group of nations – GDP per hour worked, currencies converted at purchasing power parity and expressed as constant 2010 US$. The fit (solid line) is a logistic function, corresponding to an annual growth rate of 2.9% in 1970, dropping to 1.2% in 2014. OECD data.
The second graph shows the evolution of labour productivity in a few developed countries as expressed as a fraction of this G7 average.
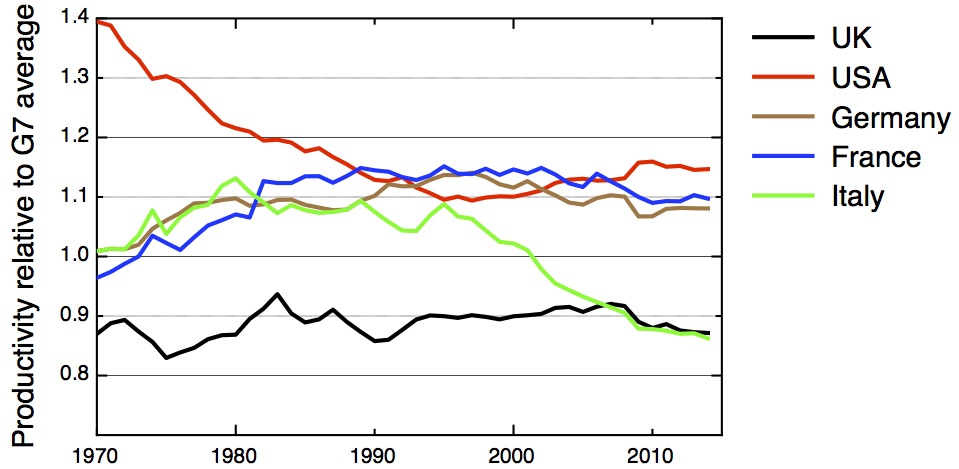
Labour productivity relative to the G7 average. OECD data
Both at the beginning of the period, in 1970, and at the present day, the USA is the world’s productivity leader, the nation at the technology frontier. But the intervening period saw a long relative decline through the 1970s and ’80s, and a less dramatic recovery. The mirror image of this performance is shown by France and Germany, whose labour productivity performances have marched in step. France and Germany’s relative improvement in productivity performance took them ahead of the USA on this measure in the early 1990’s, but they have slipped back slightly in the last decade.
The UK, however, has been a persistent productivity laggard. Its low point was reached in 1975, when its productivity fell to 17% below the G7 average. After a bumpy performance in the 1980s, there was a slow improvement in the ’90s and ’00s, but much of this ground was lost in the financial crisis of 2008, leaving UK productivity around 13% below the G7 average, and 24% below the world’s productivity leader, the USA.
It is Italy, however, that has had the most dramatic evolution, beginning the period showing the same improvement as France and Germany, but then enduring a long decline, to end up with a productivity performance as poor as the UK’s.