It’s been widely reported that the government is considering lowering the earnings threshold at which people need to start paying back their student loans. Let’s leave aside, for a moment, the question of whether it’s good economic sense for some graduates, at relatively early stages of their careers, to be facing very high effective marginal tax rates, or indeed bigger questions of the fairness of the current split in tax burden between young and old. The fundamental reason this change is having to be considered reflects the fact that, contrary to the expectations of economists and the experience of the rest of the post-war period, average wages in the UK have been stagnant for a decade. Worsening terms for student loans represent just one example of the way we’re starting to see the unfulfilled promise of continued economic growth having depressing and unwelcome real-world effects.
The key number in understanding the UK’s byzantine student finance system is the so-called RAB charge. When a student goes to university, the Government fronts up a fee to the university – currently £9250 a year (except in Wales) – and in some circumstances advances a loan for living expenses. In return, the student agrees to repay the loan in monthly instalments that depend on their income, with any unpaid portion of the loan being written off after 30 years. So, the fraction of the money the government doesn’t get back depends on the average level of wages, projected 30 years into the future. The less wages rise, the higher the fraction of the loan the government doesn’t recover. This fraction is known as the RAB charge, and is counted as a cost in the government’s accounts.
When the current student loan scheme was introduced by the Coalition government in 2012, the RAB charge was expected to be about 30%. As the years went on, this number increased: for 2014, it was estimated at 45%, and by 2020, the RAB charge stood at 53% – the government expected less than half of the student loans advanced that year to be repaid. The total advanced by the government under the student loan scheme that year was £19.1 billion, so under the original assumptions of the scheme, the cost to the government would have been £5.7 billion. Instead, under the current assumptions, the cost is now more than £10 billion, largely due to the failure of the average wage growth anticipated in 2012 to materialise.
Much of the discussion around the cost of the student finance system now revolves around the calculated return to individual degrees, by subject and institution. The creation of a large data-set linking subject studied to income achieved makes it possible to identify those degrees that provide the highest and lowest financial returns. This is fascinating and useful data, but there’s a danger of misinterpreting it, to suggest that the problem of the high cost to the government of the current HE funding system is the result of bad choices by individuals, and of universities offering “poor value” degrees. Instead, the fundamental issue is a collective one, of the economy’s failure over the last decade to deliver the progressively rising wages we had come to expect in the post-war period.
It’s clear from the data that if an able individual wants to maximise their earning power, they should do a degree in economics rather than, say, music. But from that, it doesn’t follow that the nation would be more prosperous if every student studied economics. There is an issue about how to find the optimum distribution of subjects studied that matches the changing needs of an economy, but the first order determinant of the overall cost of the HE funding system is the average wage that the economy can sustain. The problem we have isn’t low value degrees, it’s a low value economy.
The reason wages have been stagnant is straightforward – the regular, year-on-year, increases in productivity we had become accustomed to in the post-war period stopped around the time of the global financial crisis, and have not yet returned. Labour productivity measures the value added, on average, by an hour of work, so given a relatively constant split between the reward to capital and labour, we would expect labour productivity and average wages to track each other quite closely. My first plot – taken from the Treasury’s March 2020 Plan for Growth – shows that this relationship has indeed held quite closely in the UK over the last twenty years.
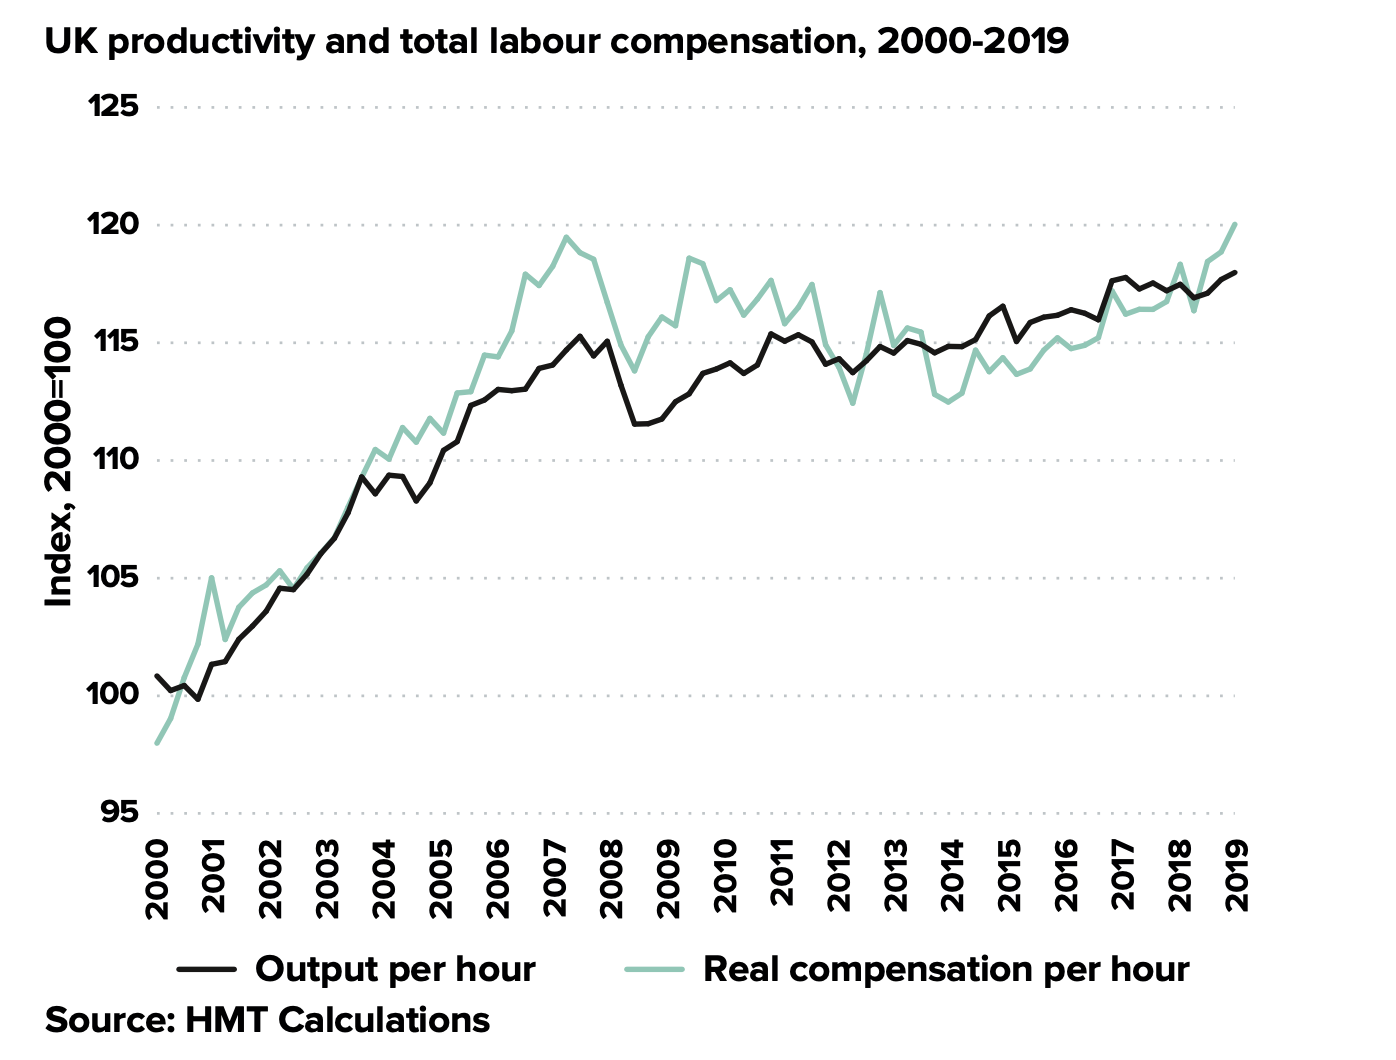
The relationship between labour productivity (output per hour) and total labour compensation. From HM Treasury’s Build Back Better: our plan for growth, March 2021.
As the Treasury said in the March 2021 Plan for Growth, “In the long run, productivity gains are the fundamental source of improvements in prosperity. Productivity is closely linked to incomes and living standards and supports employment. Improvements in productivity free up money to invest in jobs and support our ability to spend on public services.” The corollary of this is that, without productivity growth, we see stagnant living standards, and tighter fiscal conditions, leading to poorer public services. The story of the swelling RAB charge for the student finance system is just one example of the malignant effect of productivity stagnation on public finances.
It’s conventional wisdom to look back to the 1970’s as the nadir of UK economic performance. But measured by productivity growth, the last decade has been much worse. From 1971 to 2006, labour productivity grew at a remarkably steady rate of about 2.3% a year – and this provided the material for sustained growth in living standards. But since 2010, trend growth has remained stubbornly low – at less than 0.4% a year.

Labour productivity since 1970, with the latest prediction from the Office of Budget Responsibility. Sources: ONS, OBR Economic and Fiscal Outlook October 2021.
What are the chances of this dismal trend being broken? The forecasts of the Office of Budgetary Responsibility are based on the expectation of a modest upturn in productivity. The OBR has been predicting a recovery in productivity growth every year since 2010, and this recovery has so far failed to materialise. I’ve written a lot about productivity before (see e.g. The UK’s top six productivity underperformers,
Should economists have seen the productivity crisis coming? and Innovation, research and the UK’s productivity crisis), and I’ll surely return to the subject. In the meantime, I don’t understand why the OBR think it will be different this time, particularly given the additional headwinds the economy now faces.
Many – if not most – of the big economic transactions made, both by individuals and by governments, amount to shifting saving and consumption backwards and forwards in time. Whether it’s individuals getting a mortgage on a house, or saving for a pension, or governments borrowing money now on the basis of the expectation of future tax income, we are making assumptions about how our future income, at a personal or national level, will grow. Governments don’t repay the national debt – they hope the economy will grow fast enough to keep the interest payments manageable. If our assumptions about income growth turn out to be over-optimistic the ramifications are likely to be unpleasant. The slow unravelling of the 2012 student finance settlement is just one example.