1. On the discrepancy between ONS and HMRC estimates of business R&D.
In the UK, there are two ways in which the total amount of business R&D (BERD) is measured. The Office for National Statistics conducts an annual survey of business, in which a sample of firms is asked to report how much R&D has been carried out. Meanwhile firms can report what R&D they have carried out to the taxman – HMRC – in order to claim R&D tax credits, which according to circumstances can be a reduction of their liability for corporation tax, or an actual cash payment. In recent years, the two measures of business R&D have increasingly diverged, with substantially more R&D expenditure being claimed for tax credits than is reported in the BERD survey.
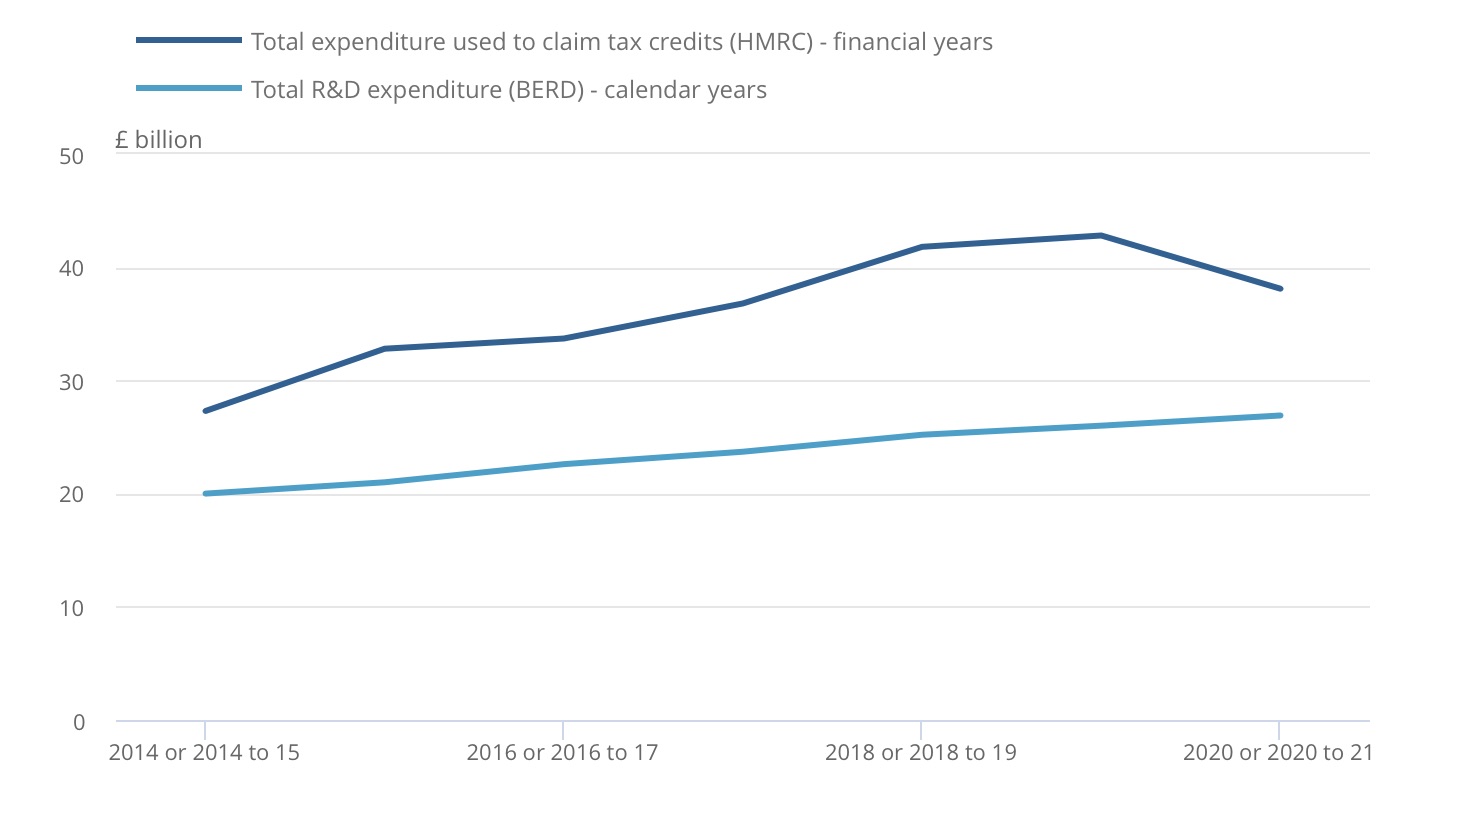
The divergence between HM Revenue and Customs (HMRC) and Business enterprise research and development (BERD) estimates of research and development (R&D) expenditure. Source: ONS.
The ONS has been looking into this divergence, and has recently published a note which concludes that the primary reason for the discrepancy is an undersampling of the small business population. On this basis, it has adjusted its previous estimate for business R&D substantially upwards – in 2020, the revision is from £26.9 bn to £43 bn. In future years, ONS will introduce improved, more robust, methodologies that will include a wider range of SMEs in the sample they survey.
In principle, there could be two possible causes for the growing divergence between the total business R&D recorded by the ONS BERD survey and the amounts underlying claims to HMRC for R&D tax credits:
a. The incentives of R&D tax credits have caused businesses to stretch the definition of R&D so they can get money for activities that are part of normal business (e.g. market research, working out how to use new equipment). This is exacerbated by the growth of an industry of consultants offering their services to firms to help them claim this money (in return for a %).
b. The ONS survey of firms (the BERD survey) has systematically undersampled a population of small and medium enterprises (SMEs), which turn out to have more R&D activity than previously believed.
In favour of (a) – the discrepancy between the two measures hasn’t been entirely static, as you’d expect if it was simply a question of missing a population of firms who had always been doing R&D at a constant rate, but who have only just been discovered. The gap has risen from £7.3 bn in 2014, to £16.6 bn in 2018. So for this explanation to hold, we need to believe not only that there is an existing population of SMEs carrying out R&D that has previously been undetected, but that this population has been substantially growing. Is R&D growth in the SME sector at a rate of £2.3 bn a year plausible? I’m not sure.
Moreover, the incentives for stretching the definition of R&D to claim free money are obvious. HMRC accept that some claims are outright fraudulent, estimating that 4.9% of the cost of the scheme is attributable to error and fraud. But there’s a big grey area between outright fraud and creative interpretation of the “Frascati” definitions of R&D.
ONS argues in favour of (b), backing this up with a detailed comparison of the microdata from the ONS survey and HMRCs returns. To add some anecdotal support, work in Greater Manchester in collaboration with a data science consultancy does seem to have identified a population of innovative SMEs in GM which has previously remained invisible, in the sense that they are firms who don’t engage with universities or with Innovate UK.
In truth, the real answer is probably some mixture of the two. We’ll learn more once the new methodology has produced a complete data set identifying the sectors and geographical locations of R&D performing firms.
2. Policy implications
Figures for total R&D spending (including both business and public sector R&D) as a proportion of GDP provide a useful measure of the overall research intensity of the UK economy and form the basis for international comparisons. The previous figure for R&D intensity – about 1.7% – put the UK between the Czech Republic and Italy. The new estimates suggest a revised figure of 2.4%, which would put the UK roughly on a par with Belgium, slightly above France, but behind the USA and Germany, and still a long way behind leaders like Korea and Israel. Of course, when making these international comparisons, a natural question is how accurate are the R&D statistics in these other countries. This is a good question that could be investigated by OECD, who collate international R&D statistics.
The international comparison has driven a target for R&D intensity that the government committed to – that it would achieve an R&D intensity equal to the OECD average. At the time when the target was formulated this average was indeed equal to 2.4%. However, the OECD average is a moving target since other countries are increasing their own R&D – it’s now above 2.5%. One can also ask whether a target to achieve international mediocrity is stretching enough.
There are more fundamental issues with the idea of having an R&D intensity target at all. One quirk of expressing the target as a % of GDP is that one can achieve it by driving down the denominator; certainly GDP growth in the UK has been disappointing for the last 12 years, as the Prime Minister has reminded us. One could argue that a numerical target for R&D is arbitrary and one should concentrate more on the instrumental outcomes one wants to achieve from the research – higher growth, more rapid and cost effective progress towards net zero, better population health outcomes etc. As I wrote myself recently in my survey of the UK R&D landscape:
“An R&D target should be thought of not as an end in itself, but as a means to an end. We should start by asking what kind of economy do we need, if we are to meet the big strategic goals that I discussed in the first part of this series. Given a clearer view about that, we’ll have a better understanding the necessary fraction of national resources that we should devote to research and development. I don’t know if that would produce the exact figure of 2.4%, but I wouldn’t be surprised if it was significantly higher.”
Perhaps the most problematic implication of a BERD upgrade is the enduring puzzle that productivity growth remains very slow. This extra, previously unrecorded R&D, doesn’t seem to have translated into productivity growth as we would expect.
This raises the broader question of why we think the government should support business R&D at all, whether through R&D tax credits or through other means. The classical argument is that private sector R&D leads to wider benefits from the economy that aren’t captured by the firms that make the investments, so in the absence of government firms will invest less in R&D that would be socially optimal. This leads to the question of whether all kinds of R&D, in all kinds of company (e.g. large and small) lead to equal degrees of wider spillover effects (and the same question can be asked of intangible investments more generally). If the kinds of R&D that are now being revealed with the new methodology do have smaller spillovers than other types, one might ask what kind of interventions could improve those.
3. Political implications
As others have observed, the chief danger of the revision is that in times of fiscal retrenchment, the government could declare “mission accomplished” and delay or cancel increases in public R&D. This danger seems very real given the direction of the current government. The opposition, on the other hand, has called for an R&D target of 3% of GDP, so there is plenty of room there.
There is an argument that the revision suggests that public R&D is even more effective than we thought in generating private sector R&D – the leverage effect is stronger than we thought. For this argument to be convincing, we’d need to understand the degree to which the companies doing this R&D are connected to the wider innovation system. But it doesn’t then support the wider argument for R&D as a driver of productivity growth – we have the R&D intensity we aspired to, so why aren’t we seeing the benefits in the productivity figures?
There are possible arguments that our focus in business R&D has been too much on the big incumbents – the GSKs and Rolls Royces – whose R&D is very visible. On the other hand, this connects to the long-running question of why we don’t have more of those big incumbents? At this point, we should recall that there are only two UK companies in the world top-100 of R&D performers – AstraZeneca and GSK. So why aren’t some of these previously unseen R&D intensive companies scaling up to become the new big players?
There is much yet to understand here.
Richard – thank you for writing this blog. This is an incredibly interesting time for innovation.
I agree completely with what you’ve said here, especially that we may be doing lots of R&D that isn’t producing many benefits.
However, it seems the revision is because the ONS thinks there are lots more SMEs doing R&D than thought otherwise. That evidence seems to be counter to your final point on there may be too much R&D in big incumbents. It would be interesting to see how the SME / large company R&D split compares to other OECD. If I remember correctly, Nicholas Bloom has done some excellent work on the social returns, spillovers, from R&D and firm size.
Also all this could be a result of our SME R&D tax credit is 2-3x more generous than the R&D Expenditure Credit used by large companies which is maybe why we have so much SME R&D. An innovation policy that actually works?
I wasn’t so much arguing that we had too much R&D in big incumbents – rather the contrary, I wish we had more big incumbents. More that public R&D policy may perhaps be too swayed by those incumbents we do have.
Yes, as it happens having written the blog I looked up some of that Bloom work (wrong order, I know…), e.g. http://eprints.lse.ac.uk/46852/ – this makes the point that “smaller firms generate lower social returns to R&D because they operate more in technological niches”, which does seem intuitively reasonable. Here’s another paper that’s fascinating on how the degree of spillover might change in the pharma industry with a move from in-house R&D to buying in R&D from CROs. https://www.sciencedirect.com/science/article/pii/S1359644622003038
It all supports the view that we need to think about what kind of R&D, in what kind of institution, is happening, as much as the total volume of R&D.
If the impact of R&D spend on growth and productivity is uncertain and nonlinear…as it must be reasonable to assume..why is there not more focus on improving that connection? Real market need and evidence of product/market-fit seem to be the obvious mitigation in the respect.
So, yes, more investment in R&D; and yes more incentives for BERD, and yes more HERD in parts of the UK outside the south east…but it seem without more Government intervention to support firms in developing R&D informed by business models based on intense ‘customer-discovery’ and assessment of market need, focus on spend alone will miss the mark.
(This is why I think IUK’s pilot around Scale the Edge etc is of value… especially if it implemented with an eye to Levelling up.)