It’s been an interesting week in UK politics. On Wednesday the Chancellor of the Exchequer delivered a budget against the backdrop of an economic situation much worse than it seemed last November, at the time of his Autumn Statement. At the heart of the bleak economic news was disappointment about productivity – the Office of Budgetary Responsibility (the OBR) downgraded its forecasts for future productivity growth; as a result their forecasts for tax income went down, so to meet the government’s self-imposed targets on deficit reduction further spending cuts had to be pencilled in. Among those spending cuts were cuts to the allowances to disabled people – the political fall-out from which we’re still seeing.
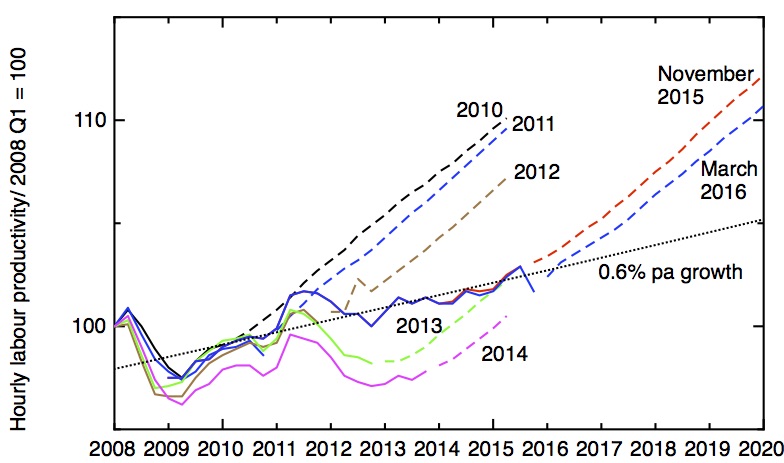
Labour productivity according to the successive Office of Budgetary Responsibility’s Economic and Fiscal Assessments for the years indicated, showing estimates of productivity up to the time of publication of each report (solid lines), and predictions for the future (dotted lines). The dotted line is best fit to the post 2009 trend, representing 0.6% annual growth. Data for 2010-2014 from the October 2015 OBR Forecast Evaluation Report, for 2015 and 2016 from the March 2016 OBR Economic and Fiscal Outlook.
The media focus has shifted to the political soap-opera of ministerial resignations and recriminations, but we shouldn’t forget the story of the productivity disappointment, because that’s at the heart of what’s happened. To see why, take a look at my graph, which shows how the government’s optimistic predictions for productivity growth have repeatedly been dashed.
As an earlier post of mine shows, UK labour productivity – that’s the average amount of economic output, in real terms, produced per hour of work – increased fairly steadily at a bit more than 2% a year since 1970. That changed in the 2008 financial crisis, when labour productivity dramatically fell, and since when it has recovered only very slowly, only last year reaching once again its pre-crisis peak. Ever since 2010 the Office of Budgetary Responsibility (along with most other forecasters, it should be said) have been expecting productivity growth to resume its pre-crisis rates. And ever since 2010, the predicted recovery in productivity growth has failed to materialise.
Last year, a majority Conservative government was elected on a promise to eliminate the fiscal deficit in five years, with a focus on cutting spending rather than raising taxes. Many commentators felt the necessary cuts were undeliverable, with cuts in benefits for the working poor causing particular controversy. But over the summer and autumn, there was increasing optimism in government that the long-standing productivity slowdown had finally come to an end. A close look at my graph shows why – the first three points from 2015 in the solid line (representing the latest estimate of labour productivity, plotted quarter by quarter) showed an encouraging upward trend. In time for the November autumn statement, the OBR pencilled in the red dashed line for its prediction for the future growth in productivity. This led them to predict better economic growth, better tax revenues than they had done before – miraculously, the Chancellor of the Exchequer found an extra £27 billion pounds, and the politically difficult benefit cuts could be dropped.
I have long believed that the worst people on the planet for wishfully and prematurely over-interpreting noisy data are nuclear physicists, but I now need to recognise that I was wrong, and their place should be taken by economists. Unsurprisingly, the three quarters of apparent growth in productivity in 2015 were wiped out by the downward tick in the quarter 4 (the last downward segment in the solid blue line). The OBR, and the government, has had to recognise that the apparent recovery in productivity was a false dawn. The blue dashed line represents the OBR’s new projection for productivity. It’s the difference between the red and blue dashed lines that dominates the difference between the Autumn statement, with its £27 billion windfall, and last week’s budget, with its £55 billion hole, and all the political fallout that’s followed the Chancellor’s self-imposed need to find more cuts.
The full implications of the productivity downgrade are made clear in this excellent analysis from the Resolution Foundation. Lower productivity means that GDP projections have been revised down by 0.3% a year, and wage growth – already projected to be an anaemic 1.1% a year – reduced by a further 0.1%. This means that median wages are not now expected to return to their pre-crisis real-terms value until 2021. And lower wages mean lower tax receipts – amounting to a cumulative loss of around £35 billion by 2020/21.
So the failure of pre-crisis rates of productivity growth to materialise as expected by the government and its forecasters has caused a political crisis and severely damaged the reputation of the Chancellor of the Exchequer. But taking a look at my graph again, one could argue that even the downgraded productivity prediction looks optimistic. The financial crisis is now 8 years behind us – perhaps what we’re seeing now is not a delay before the resumption of normal productivity growth of 2% or so, but a new normal of much lower productivity growth. Since 2009, productivity growth has averaged around 0.6% or so a year. If this were to continue for another four or five years, the political implications would be even more significant, with all hopes of eliminating the deficit removed.
In reality, not much can be learnt about the future trajectory of productivity growth just by eyeballing the graph – instead, one needs a better understanding of where the productivity slowdown has come from. That’s what I tried to do in my earlier 3-part series, Innovation, research and development, and the UK’s productivity crisis – these will shortly be published, in a revised and updated form, as a SPERI working paper.