How do you get economic growth? Economists have a simple answer – you can put in more labour, by having more people working for longer hours, or you can put in more capital, building more factories or buying more machines, or – and here things get a little more sketchy – you can find ways of innovating, of getting more outputs out of the same inputs. In the framework economists have developed for thinking about economic growth, the latter is called “total factor productivity”, and it is loosely equated with technological progress, taking this in its broadest sense. In the long run it is technological progress that drives improved living standards. Although we may not have a great theoretical handle on where total factor productivity comes from, its empirical study should tell us something important about the sources of our productivity growth. Or, in our current position of stagnation, why productivity growth has slowed down so much.
Of course, the economy is not a uniform thing – some parts of it may be showing very fast technological progress, like the IT industry, while other parts – running restaurants, for example, might show very little real change over the decades. These differences emerge from the sector based statistics that have been collected and analysed for the EU countries by the EU KLEMS Growth and Productivity Accounts database.
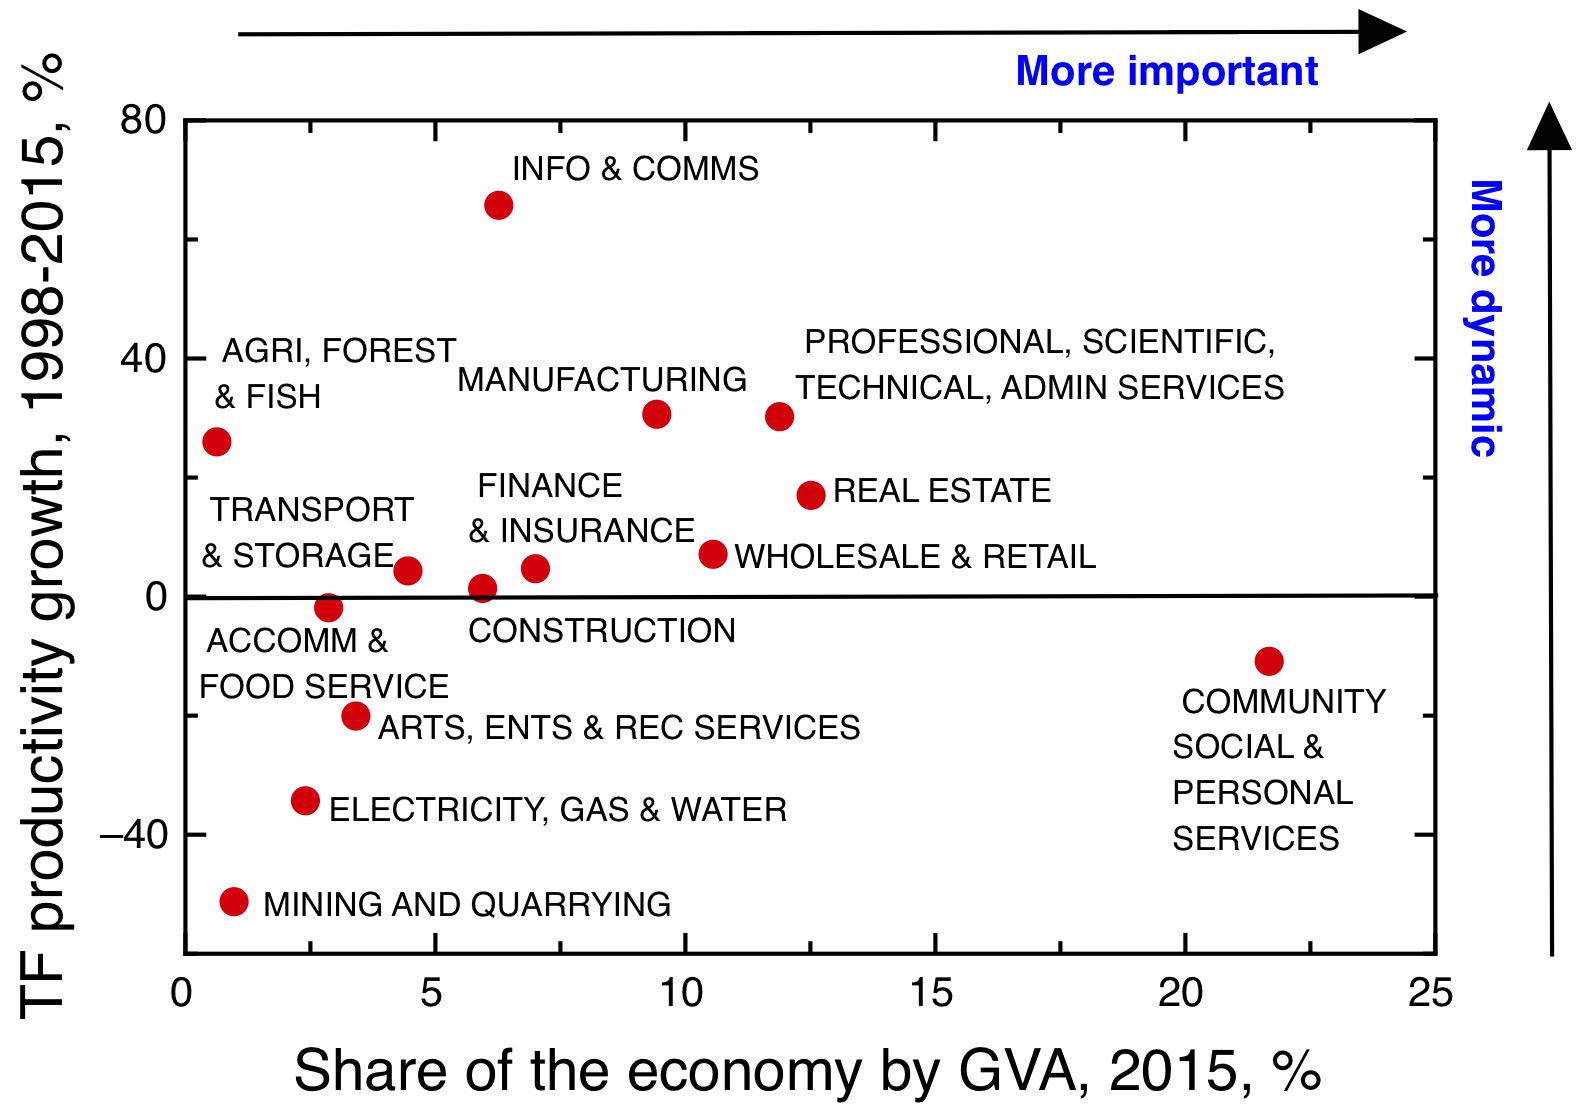
Sector percentage of 2015 economy by GVA contribution versus aggregate total factor productivity growth from 1998 to 2015. Data from EU KLEMS Growth and Productivity Accounts database.
Here’s a very simple visualisation of some key results of that data set for the UK. For each sector, the relative importance of the sector to the economy as a whole is plotted on the x-axis, expressed as a percentage of the gross value added of the whole economy. On the y-axis is plotted the total change in total factor productivity over the whole 17 year period covered by the data. This, then, is the factor by which that sector has produced more output than would be expected on the basis of additional labour and capital. This may tell us something about the relative effectiveness of technological progress in driving productivity growth in each of these sectors.
Broadly, one can read this graph as follows: the further right a sector is, the more important it is as a proportion of the whole economy, while the nearer the top a sector is, the more dynamic its performance has been over the 17 years covered by the data. Before a more detailed discussion, we should bear in mind some caveats. What goes into these numbers are the same ingredients as go into the measurement of GDP as a whole, so all the shortcomings of that statistic are potentially issues here.
A great starting point for understanding these issues is Diane Coyle’s book GDP: a brief but affectional history. The first set of issues concern what GDP measures and what it doesn’t measure. Lots of kinds of activity are important for the economy, but they only tend to count in GDP if money changes hands. New technology can shift these balances – if supermarkets replace humans at the checkouts by machines, the groceries still have to be scanned, but now the customer is doing the work for nothing.
Then there are some quite technical issues about how the measurements are done. This includes properly accounting for improvements in quality where technology is advancing very quickly; failing to fully account for the increased information transferred through a typical internet connection will mean that overall inflation will be overestimated, and productivity gains in the ICT will be understated (see e.g. A Comparison of Approaches to Deflating Telecoms Services Output, PDF). For some of the more abstract transactions in the modern economy – particularly in the banking and financial services sector, some big assumptions have to be made about where and how much value is added. For example, the method used to estimate the contribution of financial services – FISIM, for “Financial intermediation services indirectly measured” – has probably materially overstated the contribution of financial services to GDP by not handling risk correctly, as argued in this recent ONS article.
Finally, there’s the big question of whether increases in GDP correspond to increases in welfare. The general answer to this question is, obviously, not necessarily. Unlike some commentators, I don’t take this to mean that we shouldn’t take any notice of GDP – it is an important indicator of the health of an economy and its potential to supply people’s needs. But it does need looking at critically. A glazing company that spent its nights breaking shop windows and its days mending them would be increasing GDP, but not doing much for welfare – this is a ridiculous example, but there’s a continuum between what economist William Baumol called unproductive entrepreneurship, the more extractive varieties of capitalism documented by Acemoglu and Robinson – and outright organised crime.
To return to our plot, we might focus first on three dynamic sectors – information and communications, manufacturing, and professional, scientific, technical and admin services. Between them, these sectors account for a bit more than a quarter of the economy, and have shown significant improvements in total factor productivity over the period. In this sense it’s been ICT, manufacturing and knowledge-based services that have driven the UK economy over this period.
Next we have a massive sector that is important, but not yet dynamic, in the sense of having demonstrated slightly negative total factor productivity growth over the period. This comprises community, personal and social services – notably including education, health and social care. Of course, in service activities like health and social care it’s very easy to mischaracterise as a lowering of productivity a change that actually corresponds to an increase in welfare. On the other hand, I’ve argued elsewhere that we’ve not devoted enough attention to the kinds of technological innovation in health and social care sectors that could deliver genuine productivity increases.
Real estate comprises a sector that is both significant in size, and has shown significant apparent increases in total factor productivity. This is a point at which I think one should question the nature of the value added. A real estate business makes money by taking a commission on property transactions; hence an increase in property prices, given constant transaction volume, leads to an apparent increase in productivity. Yet I’m not convinced that a continuous increase in property prices represents the economy generating real value for people.
Finance and insurance represents a significant part of the economy – 7% – but its overall long term increase in total factor productivity is unimpressive, and probably overstated. The importance of this sector in thinking about the UK economy represents a distortion of our political economy.
The big outlier at the bottom left of the plot is mining and quarrying, whose total factor productivity has dropped by 50% – what isn’t shown is that its share of the economy has substantially fallen over the period too. The biggest contributor to this sector is North Sea oil, whose production peaked around 2000 and which has since been rapidly falling. The drop in total factor productivity does not, of course, mean that technological progress has gone backwards in this sector. Quite the opposite – as the easy oil fields are exhausted, more resource – and better technology – are required to extract what remains. This should remind us of one massive weakness in GDP as a sole measure of economic progress – it doesn’t take account of the balance sheet, of the non-renewable natural resources we use to create that GDP. The North Sea oil has largely gone now and this represents an ongoing headwind to the UK economy that will need more innovation in other sectors to overcome.
This approach is limited by the way the economy needs to be divided up into sectors. Of course, this sectoral breakdown is very coarse – within each sector there are likely to be outliers with very high total productivity growth which dramatically pull up the average of the whole sector. More fundamentally, it’s not obvious that the complex, networked nature of the modern economy is well captured by these rather rigid barriers. Many of the most successful manufacturing enterprises add big value to their products with the services that come attached to them, for example.
We can look into the EU Klems data at a slightly finer grained level; the next plot shows importance and dynamism for the various subsectors of manufacturing. This shows well the wide dispersions within the overall sectors – and of course within each of these subsectors there will be yet more dispersion.

Sub-sector fraction of 2015 economy by GVA contribution versus aggregate total factor productivity growth from 1998 to 2015 for subsectors of manufacturing. Data from EU KLEMS Growth and Productivity Accounts database.
The results are perhaps unsurprising – areas traditionally considered part of high value manufacturing – transport equipment and chemicals, which include aerospace, automotive, pharmaceuticals and speciality chemicals – are found in the top right quadrant, important in terms of their share of the economy, dynamic in terms of high total factor productivity growth. The good total factor productivity performance of textiles is perhaps more surprising, for an area often written off as part of our industrial heritage. It would be interesting to look in more detail at what’s going on here, but I suspect that a big part of it could be the value that can be added by intangibles like branding and design. Total factor productivity is not just about high tech and R&D, important though the latter is.
Clearly this is a very superficial look at a very complicated area. Even within the limitations of the EU Klems data set, I’ve not considered how rates of TFP growth have varied by time – before and after the global financial crisis, for example. Nor have I considered the way shifts between sectors have contributed to overall changes in productivity across the economy – I’ve focused only on rates, not on starting levels. And of course, we’re talking here about history, which isn’t always a good guide to the future, where there will be a whole new set of technological opportunities and competitive challenges. But as we start to get serious about industrial strategy, these are the sorts of questions that we need to be looking into.