I’ve recently read Dietrich Vollrath’s book “Fully Grown: why a stagnant economy is a sign of success”. It’s interesting and well-written, though I’m not entirely convinced by the conclusion that the sub-title summarises. I’ll write more about that later, but it did prompt me to think more about Baumol’s cost disease, something I’ve written about in an earlier post: How cheaper steel makes nights out more expensive (and why that’s a good thing).
In this well-known phenomenon, a differential in productivity growth rate between goods and services leads both to the cost of services relative to goods increasing, and to services taking a larger share of the economy. It’s this shift of the economy from high-productivity-growth goods manufacturing into low-productivity-growth services that Vollrath ascribes part of our current growth slowdown to, and he thinks this is entirely positive.
Vollrath introduces a simple toy model to think about Baumol’s cost disease. It’s simple enough to express this mathematically, but when you do this it produces some apparently paradoxical results. I think reflecting on these paradoxes can give some insight into the difficulties of measuring growth in an economy in which one sector advances much faster than another. As I’ve written before, this highly uneven technological progress is very characteristic of our economy, where, for example, we’ve seen orders of magnitude increase in computing power in the last century, while in other sectors, like construction, little has changed. For the mathematical details, see these notes (PDF) – here I summarise some of the main results.
In the model, we imagine an economy with just two sectors, goods and services. On the goods side, technological progress results in an exponential increase in time of output for a given labour input. For services, though, the output productivity remains constant. Baumol’s key insight was that, although the goods productivity grows faster than services productivity, given some sort of working labour market, there’s a tendency for the wages in the two sectors to equalise, meaning that the price of goods must fall relative to the price of services, in proportion to the ratio of their productivities.
But just because the price of goods is falling relative to services doesn’t mean that people will simply buy more stuff. Instead they can spend some of the money they save from the falling prices of goods by buying more services, while still ending up with more goods. The economy will adjust to these preferences by switching labour from making goods to delivering services. The net result will be an increase in the number of goods produced, because the increase in productivity outweighs the drop in the number of workers in the goods sector, while the output of the service sector will increase too, simply because more people are working in it.
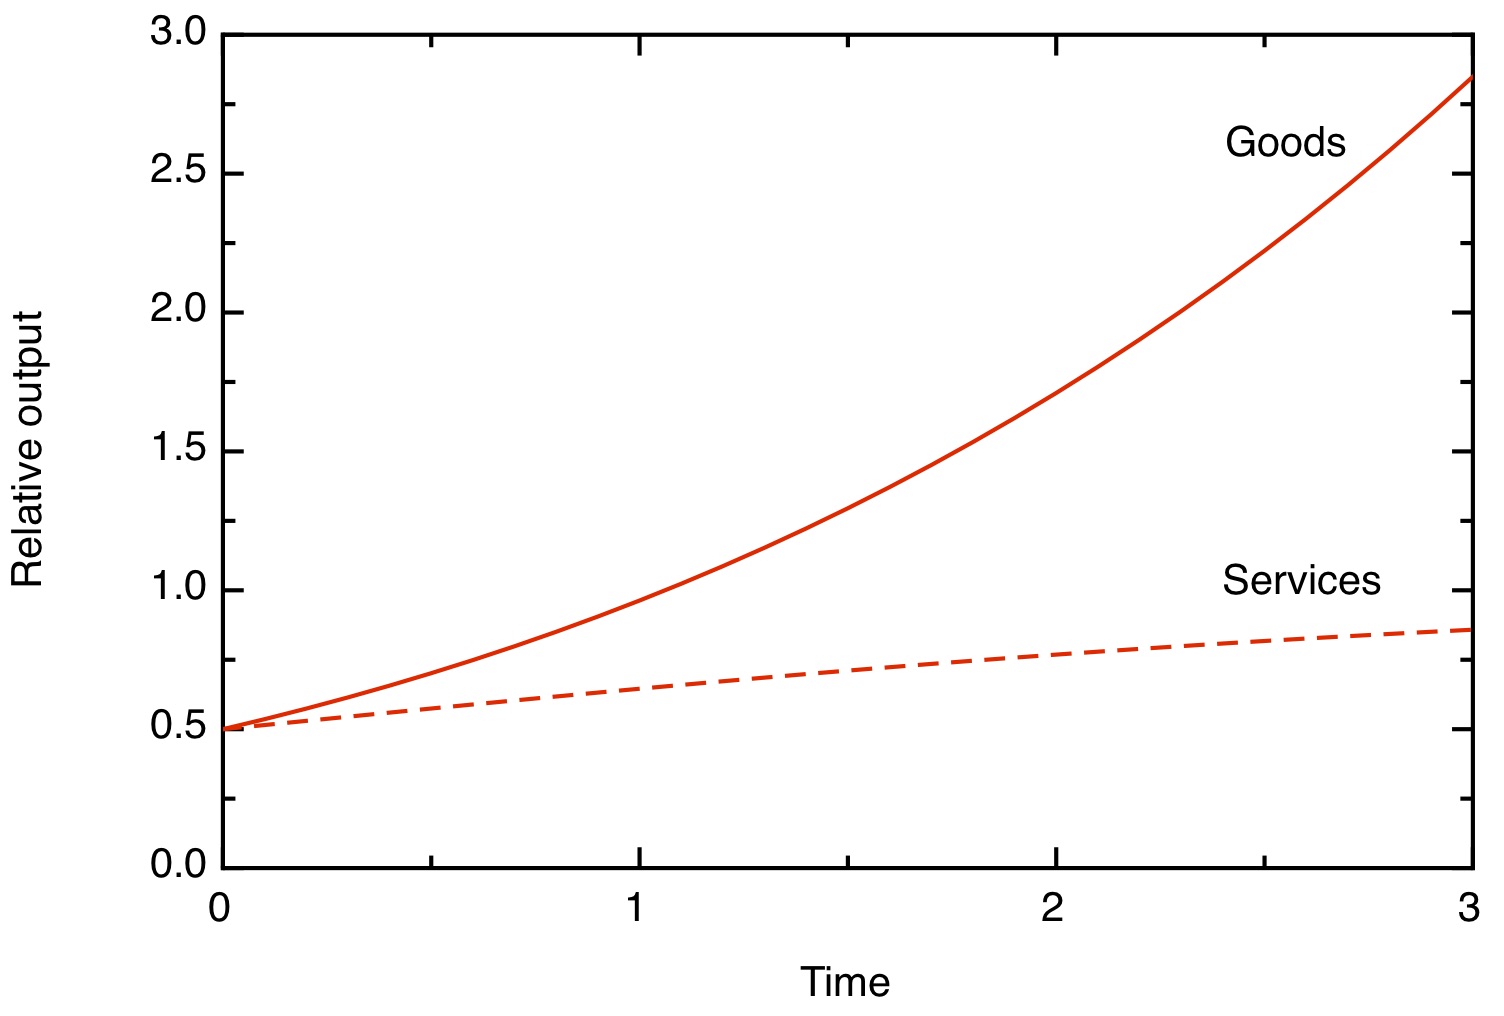
The growth of output of goods and services in a toy model of the economy, in which the output productivity of the goods sector grows exponentially, while the output productivity of services is static.
It’s clear from this plot that “cost disease” is a misnomer – despite the (exponentially) rising cost of services relative to goods, the consumers in our economy become better off with time. Not only do they get more goods, but they’re able to afford more services too, despite the latter’s rising relative cost.
The paradoxes arise when we try and compute the money value of the goods and services produced. We know that the price of services is increasing exponentially compared to the price of goods – and that means that wages, if we expressed them in units of numbers of goods, are increasing exponentially too. To find the real price of goods and services we need to correct for this inflation (or, if we measure our prices with respect to services, deflation). We do this by calculating the price of a basket of goods and services, where we weight the contribution of each by their weight in the total economy. When we do this, we find the rather paradoxical result in the next plot.
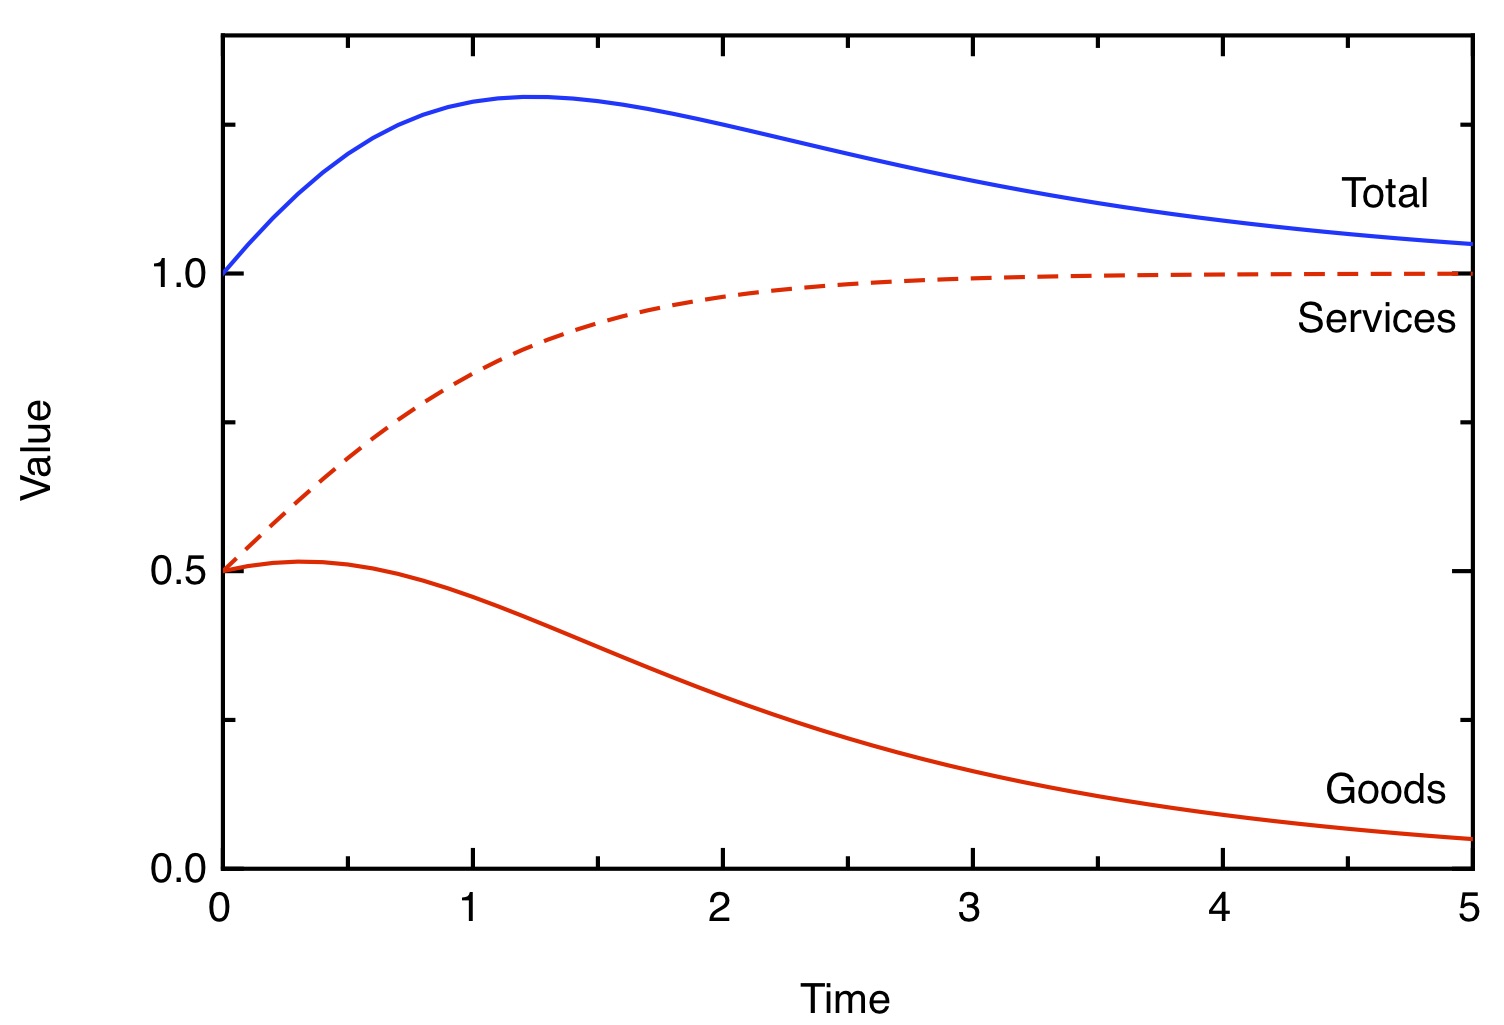
The value in real money of goods and services in a toy model of the economy. The correction for inflation is made using a deflator combining the prices of goods and services weighted by their relative importance in the overall economy.
At the earliest times, the value of both goods and services outputs increases, but the increase in production of goods cannot keep up with the fall in their cost, so their total value diminishes. The value of services increases, but after the productivity of goods has roughly trebled the total size of the economy starts to decline. At long times, the real value of services output saturates at twice its initial value, reflecting the fact that the economy is devoting twice as much labour to it, but the value of the goods output dwindles to zero. The service sector has doubled in size, but the goods sector has (in terms of its contribution to the economy) gone from making up half the economy to making no contribution to it at all (in spite of the fact that we are able to consume an unlimited number of goods). The net result is that the overall size of the economy appears unchanged. Goods, now essentially being free, make no contribution at all to GDP.
One thing this paradox emphasises is that we need to be careful about how we define productivity. In this model, we’ve expressed the exponentially increasing productivity of the goods sector in terms of the amount of goods produced. But economists measure productivity by reference to the monetary value of the output produced. In these terms, even though there’s been no increase in the productivity of the service sector in terms of the output it produces, because of the increasing price of services relative to goods, the monetary value of that output has increased. Baumol’s cost disease is in fact a mechanism by which radically different rates of output productivity growth are evened out across different economic sectors to yield productivities measured in real money which are much more comparable to each other.
This toy model is just that – a hopelessly oversimplified version of the real world. But it does suggest some insights. We should think of it as a cartoon version of what happens when any kind of new, fast developing invention is introduced into an otherwise static economy. What we see is an initial period of growth, after which the new invention becomes so cheap we don’t count it in the economy any more. This perhaps suggests a lesson about how we should think about GDP changes over the long run – an exponential growth in output productivity in one part of the economy doesn’t create exponential growth in the economy as a whole – instead it gives the economy a temporary, one-off boost, but leaves a lasting legacy of increased utility that is not captured in the GDP figure.
Economic growth needs technological innovation, but this innovation is necessarily uneven. The mechanism unhappily named Baumol’s cost disease spreads out the benefits of rapid progress in a few areas across the economy as a whole, creating the impression of steady progress across the whole economy from the introduction and rapid improvement of a continuous sequence of new inventions.
For more details, including the maths, see this PDF: Notes on a toy model of Baumol’s cost “disease”