“Eroom’s law” is the name given by pharma industry analyst Jack Scannell to the observation that the productivity of research and development in the pharmaceutical industry has been falling exponentially for decades – discussed in my earlier post Productivity: in R&D, healthcare and the whole economy. The name is an ironic play on Moore’s law, the statement that the number of transistors on an integrated circuit increases exponentially.
It’s Moore’s law that has underlain the orders of magnitude increases in computing power we’ve grown used to. But if computing power has been increasing exponentially, what can we say about the productivity of the research and development effort that’s underpinned those increases? It turns out that in the semiconductor industry, too, research and development productivity has been falling exponentially. Eroom’s law describes the R&D effort needed to deliver Moore’s law – and the unsustainability of this situation must surely play a large part in the slow-down in the growth in computing power that we are seeing now.
Falling R&D productivity has been explicitly studied by the economists Nicholas Bloom, Charles Jones, John Van Reenen and Michael Webb, in a paper called “Are ideas getting harder to find?” (PDF). I discussed an earlier version of this paper here – I made some criticisms of the paper, though I think its broad thrust is right. One of the case studies the economists look at is indeed the electronics industry, and there’s one particular problem with their reasoning that I want to focus on here – though fixing this actually makes their overall argument stronger.
The authors estimate the total world R&D effort underlying Moore’s law, and conclude: “The striking fact, shown in Figure 4, is that research effort has risen by a factor of 18 since 1971. This increase occurs while the growth rate of chip density is more or less stable: the constant exponential growth implied by Moore’s Law has been achieved only by a massive increase in the amount of resources devoted to pushing the frontier forward.”
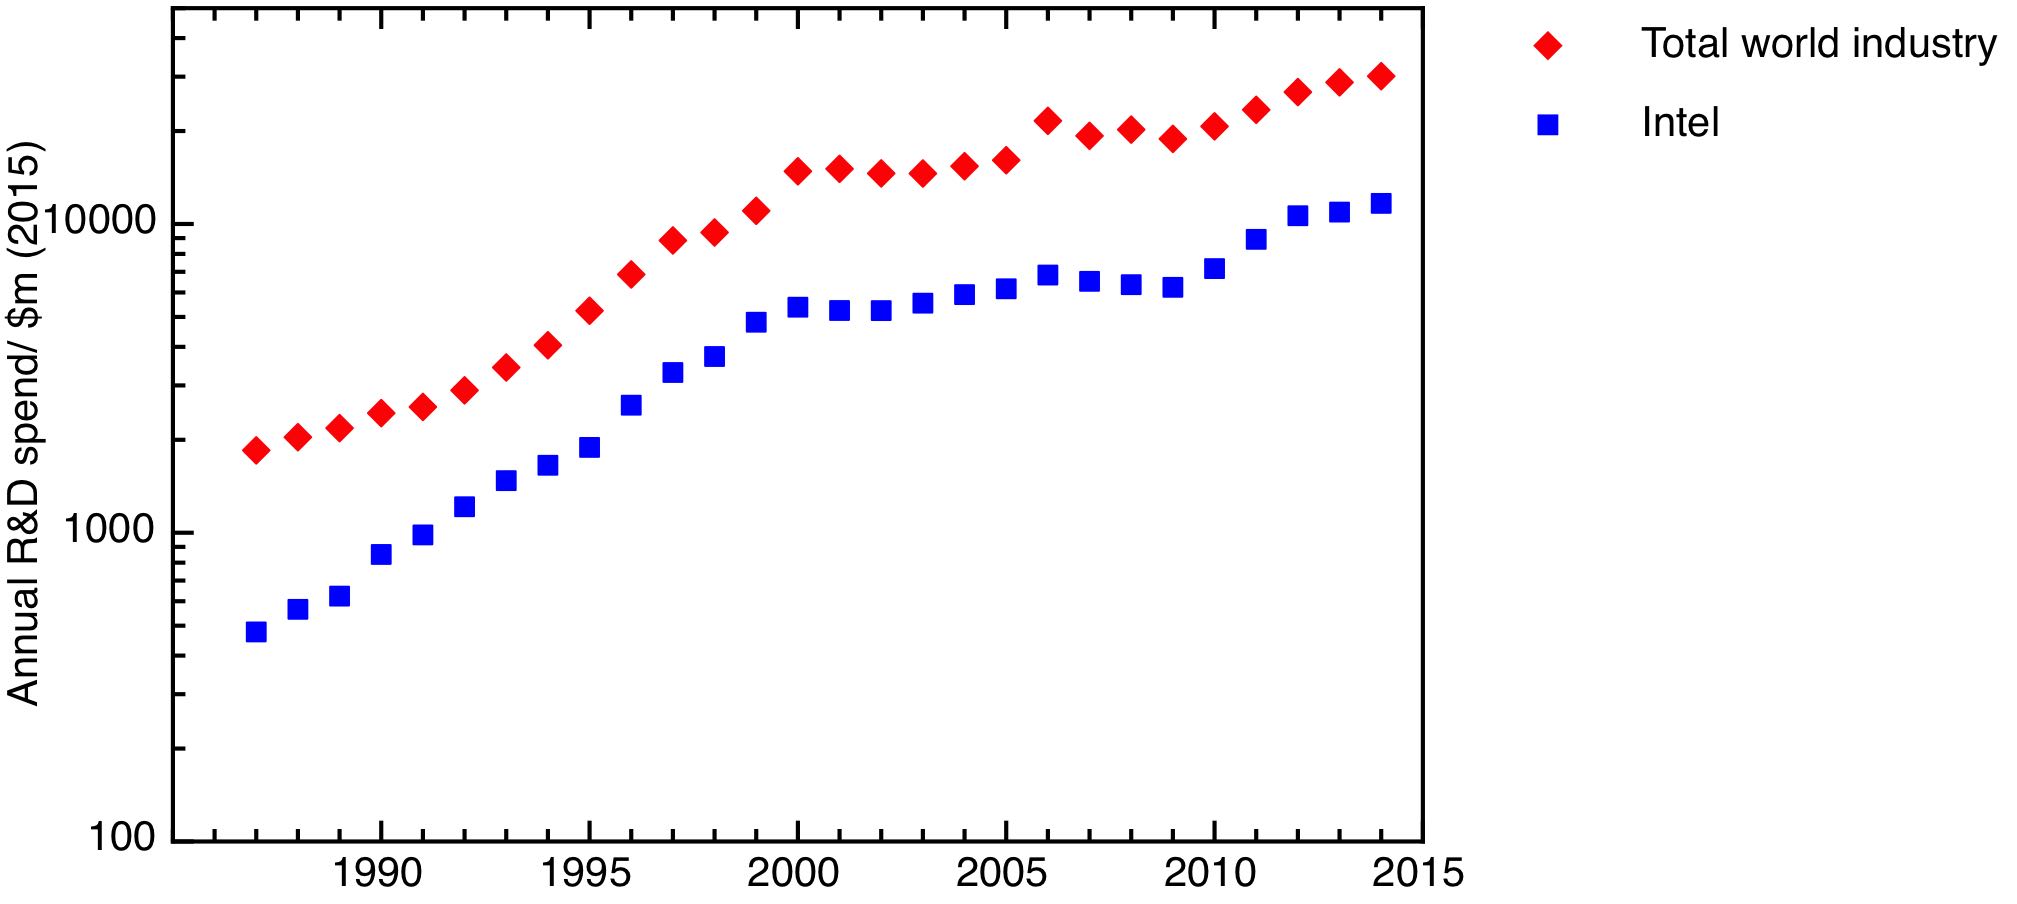
R&D expenditure in the microelectronics industry, showing Intel’s R&D expenditure, and a broader estimate of world microelectronics R&D including semiconductor companies and equipment manufacturers. Data from the “Are Ideas Getting Harder to Find?” dataset on Chad Jones’s website. Inflation corrected using the US GDP deflator.
The growth in R&D effort is illustrated in my first plot, which compares the growth of world R&D expenditure in microelectronics with the growth of computing power. I plot two measures from the Bloom/Jones/van Reenen/Webb data set – the R&D expenditure of Intel, and an estimate of broader world R&D expenditure on integrated circuits, which includes both semiconductor companies and equipment manufacturers (I’ve corrected for inflation using the US GDP deflator). The plot shows an exponential period of increasing R&D expenditure, which levelled off around 2000, to rise again from 2010.
The weakness of their argument, that increasing R&D effort has been needed to maintain the same rate of technological improvement, is that it selects the wrong output measure. No-one is interested in how many transistors there are per chip – what matters to the user, and the wider economy – is that computing power continues to increase exponentially. As I discussed in an earlier post – Technological innovation in the linear age, the fact is that the period of maximum growth in computing power ended in 2004. Moore’s law continued after this time, but the end of Dennard scaling meant that the rate of increase of computing power began to fall. This is illustrated in my second plot. This, after a plot in Hennessy & Patterson’s textbook Computer Architecture: A Quantitative Approach (6th edn) and using their data, shows the relative computing power of microprocessors as a function of their year of introduction. The solid lines illustrate 52% pa growth from 1984 to 2003, 23% pa growth from 2003 – 201, and 9% pa growth from 2011 – 2014.
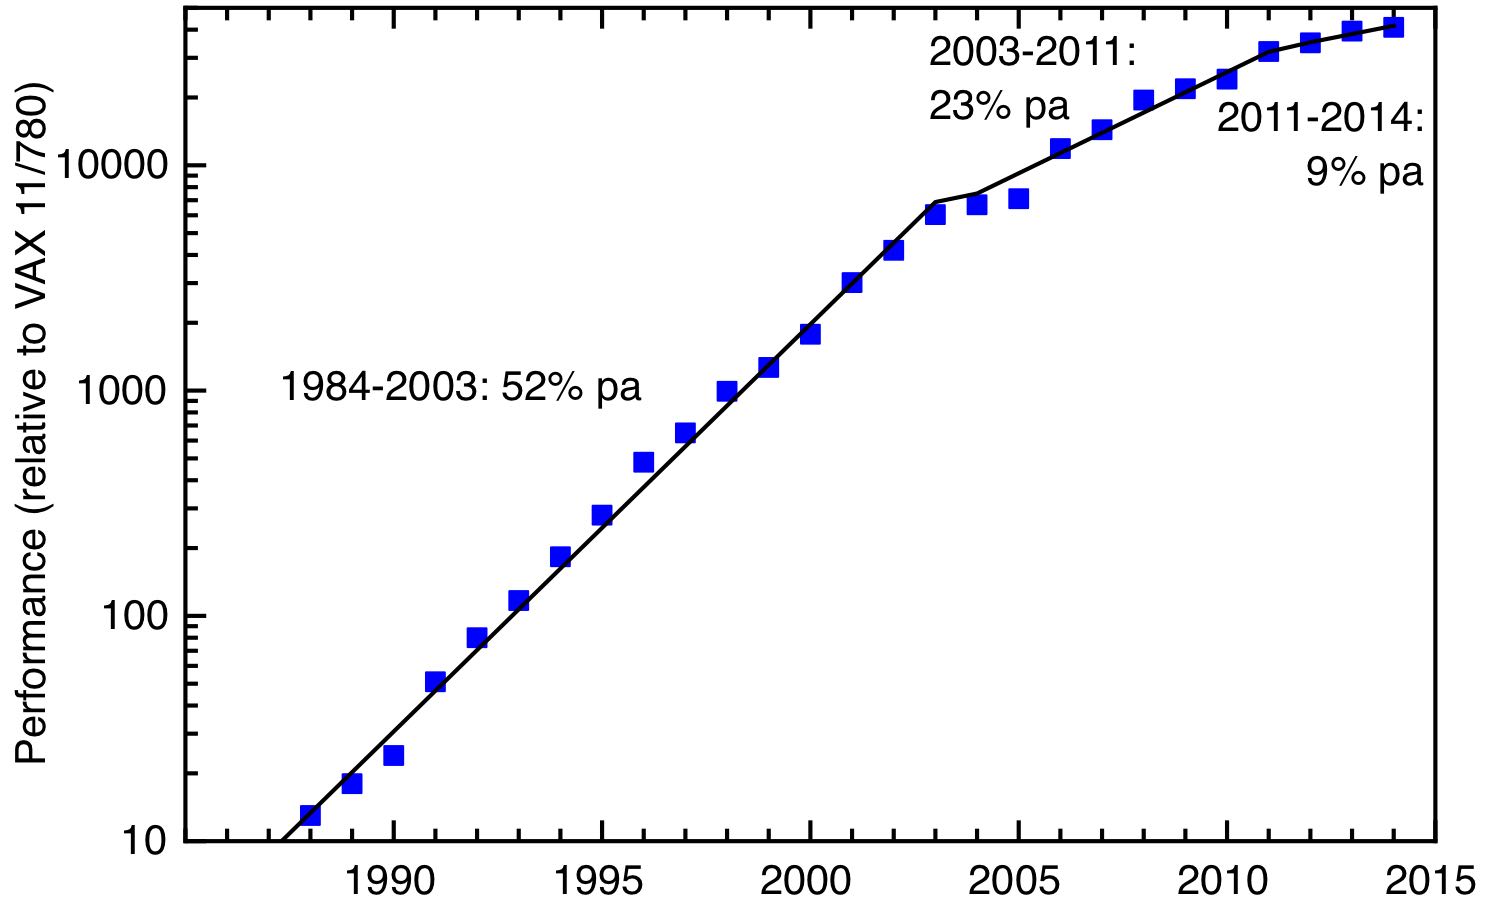
The growth in processor performance since 1988. Data from figure 1.1 in Computer Architecture: A Quantitative Approach (6th edn) by Hennessy & Patterson.
What’s interesting is that the slowdown in the rate of growth in R&D expenditure around 2000 is followed by a slowdown in the rate of growth of computing power. I’ve attempted a direct correlation between R&D expenditure and rate of increase of computing power in my next plot, which plots the R&D expenditure needed to produce a doubling of computer power as a function of time. This is a bit crude, as I’ve used the actual yearly figures without any smoothing, but it does seem to show a relatively constant increase of 18% per year, both for the total industry and for the Intel only figures.
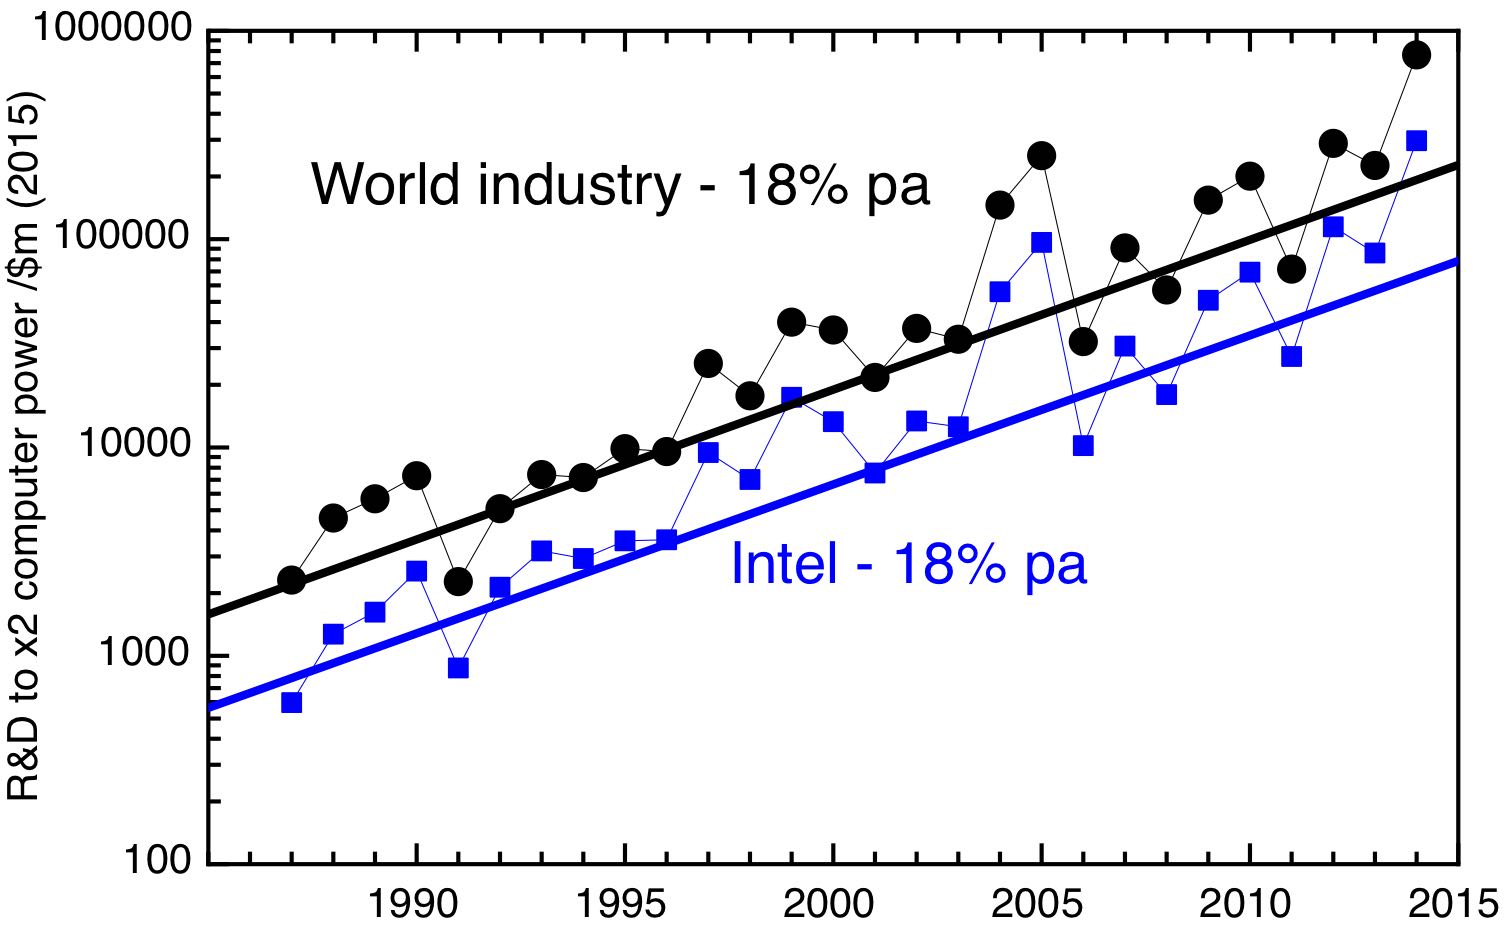
Eroom’s law at work in the semiconductor industry. Real R&D expenditure needed to produce a doubling of processing power as a function of time.
What is the cause of this exponential fall in R&D productivity? A small part reflects Baumol’s cost disease – R&D is essentially a service business done by skilled people, who command wages that reflect the growth of the whole economy rather than their own output (the Bloom et al paper accounts for this to some extent by deflating R&D expenditure by scientific salary levels rather than inflation). But this is a relatively small effect compared to the more general problem of the diminishing returns to continually improving an already very complex and sophisticated technology.
The consequence seems inescapable – at some point the economic returns of improving the technology will not justify the R&D expenditure needed, and companies will stop making the investments. We seem to be close to that point now, with Intel’s annual R&D spend – $12 billion in 2015 – only a little less than the entire R&D expenditure of the UK government, and the projected cost of doubling processor power from here exceeding $100 billion. The first sign has been the increased concentration of the industry. For the 10 nm node, only four companies remained in the game – Intel, Samsung, the Taiwanese foundry company TSMC, and GlobalFoundries, which acquired the microelectronics capabilities of AMD and IBM. As the 7 nm node is being developed, GlobalFoundries has announced that it too is stepping back from the competition to produce next-generation chips, leaving only 3 companies at the technology frontier.
The end of this remarkable half-century of exponential growth in computing power has arrived – and it’s important that economists studying economic growth come to terms with this. However, this doesn’t mean innovation comes to an end too. All periods of exponential growth in particular technologies must eventually saturate, whether that’s as a result of physical or economic limits. In order for economic growth to continue, what’s important is that entirely new technologies must appear to replace them. The urgent question we face is what new technology is now on the horizon, to drive economic growth from here.