The first of April saw the formal launch of UK Research and Innovation, the new body which will be responsible for the bulk of public science and innovation funding in the UK. All seven research councils, the innovation funding agency InnovateUK, and the research arm of the body formerly responsible for university funding in England, to be renamed Research England, have been folded into this single body, with a budget of more than £6 billion a year.
Expectations for this new body are very high. Its formation has been linked to the government’s decision to increase research funding substantially, with extra funding rising to £2.3 billion by 2021/2. This new money is explicitly linked to the need to increase the productivity of the UK economy. The government has also committed to a 10-year target of raising the overall R&D intensity of the economy from its current 1.7% to 2.4% of GDP. As I’ve discussed earlier, this is a very challenging target that will require a major change in behaviour from the UK”s private sector, as well as substantial increases in public sector R&D. UKRI has the task of ensuring that the extra public sector investment is made in ways that maximise increases in private sector R&D. All of this, of course, takes place with the background of Brexit, and the need for the UK to rebuild its business model.
There’s one factor that, unless urgently addressed, will hold UKRI back from its mission of making a significant difference to the UK’s overall productivity problems and raising the economy’s R&D intensity. That is the extraordinary and unhealthy concentration of publicly funded R&D in a relatively small part of the country – London, the Southeast, and East Anglia. Entirely uncoincidentally, these are the parts of the country with the most productive economies already. As the Industrial Strategy Commission (of which I was a member) stressed in its final report last year, unless the UK fixes its gross regional economic disparities it will never be able to prosper.
No-one has done more to bring attention to the UK’s unbalanced R&D geography than Tom Forth; everyone should read his recent article on how we should use the increase in funding to redress the balance. One key point that Tom has stressed is the geographical relationship – or lack of it – between public and private sector research. Industry spends roughly twice as much as the government on research, so reaching the 2.4% R&D intensity target will not be possible without major increases in private sector spending – roughly £14 billion a year, by my estimate. Yet classical economics tells us that firms will always underinvest in R&D, because they are unable to capture the full economic benefit of their spending, much of which “spills over” to benefit the rest of the economy. That’s the logic which convinces even HM Treasury that the state ought to support R&D.
Yet Tom Forth’s work – especially his plots of of public against private R&D spending – shows how badly government spending on R&D is matched to the demand of industry, as measured by where industry actually invests its own money.
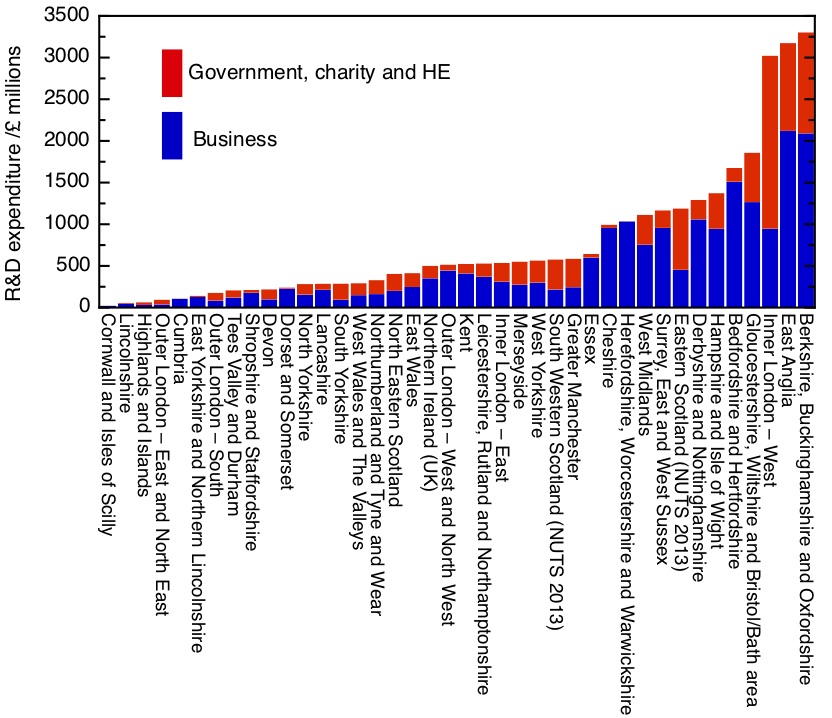
R&D funding in the business and non-business sectors (government, higher education and charity), by NUTS2 regions. 2014 figures, by sector of performance, from Eurostat.
My first graph shows how unbalanced the UK’s research landscape is. This shows R&D spending – both private and public – broken down sub-regionally. The first thing that’s obvious is the dominance of three sub-regions – Oxford and its environs, Cambridge and its sub-region, and (part of) London – inner West London. These three subregions – out of a total of 40 in the UK – account for 31% of total UK R&D spending, and an even higher fraction of spending in the government, HE and charity sectors – 41%.
There is a striking difference between these three sub-regions, though, and that is their split between public and private R&D (taking public R&D here to mean R&D carried out in government-owned laboratories, universities and the non-profit sector). Overall in the UK, the value of business R&D stands at 1.89 times the value of public R&D. East Anglia – dominated by Cambridge – does even better than this, with private sector R&D coming in at more than twice public sector R&D. This is a science-based cluster that works, with high levels of public R&D being rewarded at above average rates by private sector R&D.
The Oxford, Berks and Bucks sub-region does slightly less well in converting its very large public investment into private R&D, with a multiplier a little below the national average at 1.72.
The real anomaly, though, is Inner London (West). This single region receives by far the largest amount of public R&D spending of any single region – nearly 20% of the entire public funding for R&D. Yet the rate of return on this, in terms of private sector R&D, is only 0.46, far below the national average.
Working down the list, we find 9 sub-regions with respectable levels of total R&D. These include Bristol, Hampshire, Derby, Bedford, Surrey and the West Midlands, Worcestershire and Cheshire. With the exception of East Scotland, all these sub-regions are characterised by above average ratios of private to public sector R&D. Two sub-regions stand out for significant private sector R&D and almost no public sector activity – Cheshire, with its historic concentration of chemical and pharmaceutical industries, and Warwickshire, Herefordshire and Worcestershire.
Then we come to the long tail, with much lower investment in R&D, either public or private. All of Wales, Northern Ireland, the North of Engand, Southwest England beyond Bristol, outer east and southeast London and Kent, Lincolnshire – this is pretty much a map of left-behind Britain.
This brings us to the question: why should we worry about regional disparities in R&D? Let’s put aside for the moment any question of fairness – what it comes back to is productivity. If we plot R&D intensity against regional GDP, we find quite a respectable correlation. (Slightly to my surprise, the correlation is strongest if you plot total R&D – both public and private, rather than just business R&D. I’ve ommitted London entirely as it is such an outlier on both measures).
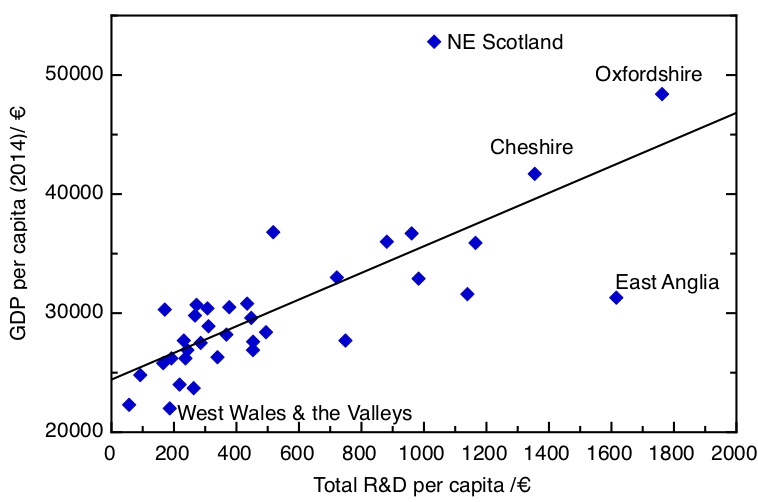
Sub-regional GDP per capita against total R&D (public and private) per capita. 2014 data, from Eurostat.
Of course, the relationship is not a straightforward one: higher R&D intensities are associated with the presence of high-productivity firms at the technology frontier, there may be a more general effect of higher skill levels associated with regions with higher R&D, and there may well be other factors, direct and indirect, at play too. We can also see outliers. NE Scotland has very high productivity but mid-level R&D investment, not doubt because of the importance of the oil industry, while East Anglia has relatively low productivity given the very high levels of R&D. I suspect the latter is associated with the relatively concentrated nature of the Cambridge cluster, whose effect doesn’t really penetrate far into a large and relatively poor rural and coastal hinterland.
As the Industrial Strategy Commission argued, just as a matter of arithmetic averages, we cannot expect the productivity of the country as a whole to grow if such a large fraction is structurally lagging. So what should we do? Different places demand different approaches, and Tom Forth has some suggestions.
On London, I agree with Tom – the over-investment of public R&D in London is a grotesque misallocation of public resources, but the realities of political economy mean it’s likely to stay that way. At the least, we certainly need to stop building new institutions there. One thing the data does highlight, though, is how concentrated even within London the investment is, so initiatives like UCL East, aiming to spread the benefits of the investment to less favoured parts of the capital, are to be welcomed.
The eight sub-regions with high private sector R&D and public underinvestment offer a clear rationale for further public investment. One needs to be aware of the arbitrary nature of these sub-regional boundaries – the strength of the Cheshire cluster is a very good reason to have a strong Chemistry department in the University of Liverpool, for example – but these regions are likely to provide some very strong investment cases for following the private sector money to support existing clusters.
I somewhat disagree with Tom on the case of Oxford and Cambridge (and here of course my biases may be showing). Tom believes that funding should be frozen in these places until they agree to allow more growth. As far as Cambridge is concerned, I’m not sure this is quite right – there seems to be a huge amount of growth happening in that city at the moment, with significant numbers of new-build apartments going up in the city, and a string of new suburbs like Eddington being built around its fringes, complete with new schools and supermarkets. The issue here is the completely inadequate transport infrastructure to get into and around the city; it’s these infrastructure problems that are stopping the further growth of what is the UK’s most successful science-based cluster, and are stopping the spread of its benefits to its less prosperous hinterland.
But this leaves the bigger problem – how can public R&D investments be used to raise productivity and economic growth in what is the majority of the country, where levels of R&D investment, both public and private, are far too small? It’s easy to imagine arbitrary and ill-thought through investments imposed on regions with no understanding of the potential their economic history and current industrial base will support. But for a counter-example, in my own city, Sheffield, I think there has been a well thought through policy based on promoting advanced manufacturing through investments in translational research and skills, which is bearing fruit through the twin routes of the attraction of inward investment from firms at the technological frontier and improving the performance of the existing business base.
Where does this leave the new organisation, UK Research and Innovation, whose job should be to rectify these issues? It’s not going to be easy, given that the cultures of the organisations UKRI are being built from have been positively opposed to place-based policy. The research councils have focused on “research excellence” as the sole criterion for funding, while the policy of InnovateUK has been to be led by industry. But “place-blind” policies inevitably lead to research concentration, though the well-known Matthew effect. I know that EPSRC at least has been seriously grappling with these issues in the last couple of years, while there is real expertise in Research England on the economic potential of universities in their cities and regions, so there is something to build on.
The early actions of the new organisation are not encouraging. The move back from Swindon to London is a retrograde step, suggesting that UKRI’s first priority is keeping ministers happy and keeping ahead of Whitehall office politics. When the Technology Strategy Board (the predecessor organisation to InnovateUK) was first set up as a free-standing funding agency, it was moved out of London to Swindon to emphasise that it served business, not Whitehall, and it was the better for it.
Moreover, the main board of UKRI is conspicuous for its lack of geographical diversity – out of 16 members, just one – Aberdeen’s Ian Diamond – is from outside London and the southeast. Allowing this situation to arise was a telling and worrying oversight.
One urgent concrete step UKRI should take is to create a high-level advisory board to hold its feet to the fire on a plan to rebalance R&D expenditure across the country. UKRI is to produce a strategy within the next month or two, and it is to be hoped that addressing the regional balance issue forms a central part of this strategy. This board should include senior representatives from the Devolved Administrations, and economic development leads from the metro mayors’ offices and combined authorities in the regions of England. At an operational level, UKRI needs to get its staff out of their London home, perhaps with regional specialists seconded to economic development units in the regions and nations.
The stakes here are high. UKRI has been set up with great expectations – the substantial injection of extra research spending, the 2.4% R&D target are signals that the government expects UKRI to deliver. If it does not produce tangible, positive effects on the wider economy – across the whole of the UK – UKRI will rightfully be judged to have failed – it will have failed the country, and it will have failed UK science. Let’s hope it can rise to the challenge.

