Some reflections on Breakneck: China’s quest to engineer the future by Dan Wang.
Dan Wang’s new book on China is rightly getting great reviews. It’s a compelling read, engagingly written, reflecting both the author’s deep understanding of China’s developing economy, and his personal sympathy with the Chinese nation. It is admiring of Chinese achievements over the last couple of decades , while being entirely clear-eyed about the deficiencies of the political system and its human costs.
The big idea behind the book is to compare and contrast the two great powers of the world today – China and the USA, summarising that comparison in a neat formula. For Wang, China is the Engineering State, while the USA is the Lawyerly Society – and from that contrast, the complementary strengths and weaknesses of the two nations can be derived.
What kind of state is China? According to Wang, it is a “Leninist Technocracy with Grand Opera tendencies”.
It’s Leninist – because it concentrates all power in the Chinese Communist Party, which will ruthlessly suppress any potential or emerging rival power structure, whether that’s an independent trade union, a civil society group, or an emerging class of plutocrats.
It’s a technocracy, because it is dominated by engineers, and brings an engineering mindset of finding technological solutions to all kinds of problems – whether material or social. In many ways, it’s a realisation of the high modernist vision of rule by experts, and Wang traces one of the big sources of difference between the China and the USA to the Western backlash against high modernism in the 60s and 70s.
Its “Grand Opera tendencies” refer the state’s tendency to intersperse periods of stability with occasional episodes of government triggered chaos – the Great Leap Forward, the Cultural Revolution – and recently, the excesses of the Net Zero policy. If this sounds like a flippant way to describe episodes containing great human tragedy, I should stress that Wang’s descriptions of, for example, some of the consequences of the one-child policy are truly harrowing.
What are the positives of the engineering state? China has built a huge amount of infrastructure – interstate highways, high speed railways, dams and power stations – at a pace – and low cost – that seems incomprehensible to Americans (or, indeed, we British). Wang acknowledges the downsides – human costs of displaced people, environmental damage, unsustainable debt overhangs. But his overall sympathies here are with the engineering state – the nowheres of “bridges to nowhere” frequently become somewheres as a result of those bridges.
Chinese achievements in infrastructure are impressive, but perhaps the most significant recent development in the Chinese economy has been the achievement of mastery in high technology manufacturing. This now amounts to technological near-supremacy in consumer electronics, telecommunications equipment and battery electric vehicles, as well as complete domination of solar cells.
This supremacy hasn’t come from frontier science, but from exalting process knowledge, and building and sustaining the engineering communities of practise that holds that process knowledge. “It’s another of the ways that the United States and China are inversions of each other. Americans expect innovations from scientists working at NASA, in universities, or in research labs. They celebrate the moment of invention: the first solar cell, the first personal computer, first in flight. In China, on the other hand, tech innovation emerges from the factory floor, when a new product is scaled up into mass production. At the heart of China’s ascendancy in advanced technology is its spectacular capacity for learning by doing and consistently improving things.”
Ironically, it has been US firms – particularly Apple and Tesla – outsourcing their own manufacturing that have driven the development of these Chinese engineering communities of practise. Apple taught Chinese engineers how to build iPhones, and in the process built sophisticated supply chains for electronic components which can then feed new industries, such as drones. Now, in a colder geopolitical climate, the Chinese Communist Party seeks to achieve similar dominance in areas like semiconductor manufacturing.
Silicon Valley used to be such a community of engineering practise, but in Wang’s view it has lost its way. Wang writes of Andy Grove, former CEO of Intel, that he “saw Silicon Valley transition from doing both invention and production to specializing only in the former. And he understood quite well that technology ecosystems would rust if the research and development no longer had a learning loop from the production process.”
The recent troubles of Intel, slipping behind TSMC at the frontier of semiconductor manufacturing, perhaps vindicates that view.
China has certainly made a firm decision to focus on manufacturing, developing science based industries like semiconductors & clean technologies, while actively suppressing the tech industry as Silicon Valley currently understands it. Xi has been discomfited that “the cutting edge of the economy seemed to have been driven by the vagaries of investors rather than the interests of the state”, while believing that social media promises “little gain in economic productivity while creating huge potential for social unrest”.
One aspect that Wang does not treat in great detail is the relationship between scientific research in China and its high technology manufacturing base. Anyone who reads the scientific literature will appreciate, not just the hugely increased volume of contributions from Chinese scientists, but also their quality and impact. What I don’t have a good sense of is how closely coupled this impressive academic effort is to the growing industry base.
But in my understanding, there are now areas where Chinese science is in the ascendancy, with brilliant individual scientists given huge resources to accelerate new applications. Quantum technology is surely one such field, under the leadership of scientists like Pan Jianwei.
What Wang does make clear is that he doesn’t go along with the comforting notion that the creativity of science can’t exist with the suppression of free speech in a Leninist state: “How is it that science can coexist with autocracy? Mostly, I believe, because the precondition for science is that abundant funds are far more critical to science than free speech, and that is something that dictators can deliver”.
But Wang does highlight the way in which the increasingly authoritarian tendencies of the Chinese state under Xi make the country increasingly uncomfortable for young creative types. Tech entrepreneurs have found that their wealth and business success is no protection against a change of mood in the Party-state, of the kind we saw in the 2021 crackdown on the tech industry.
We’re now entering a much darker world; Xi is preparing for the worst, asking China to “be ready to withstand the major test of high winds, choppy waters and even dangerous storms”. One such test, no longer inconceivable, would be outright war with the West. This fortress mentality has led to a focus on resilience, energy and food security rather than economic efficiency. In this environment, China’s manufacturing base is a huge strategic advantage.
Wang’s book is built around the contrast between China and the USA – but it’s still highly relevant for those of us in smaller countries like the UK. Wang himself was brought up in Canada, so perhaps this perspective isn’t entirely foreign to him [2].
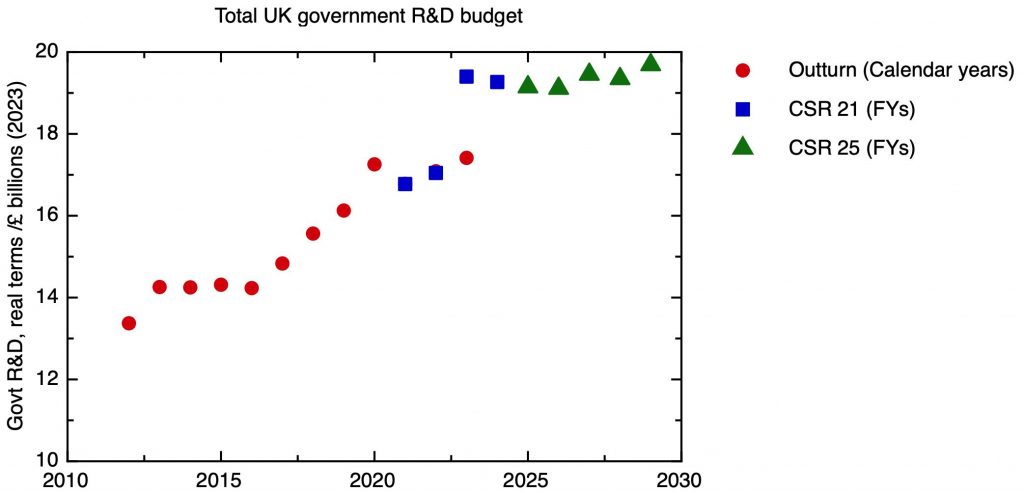
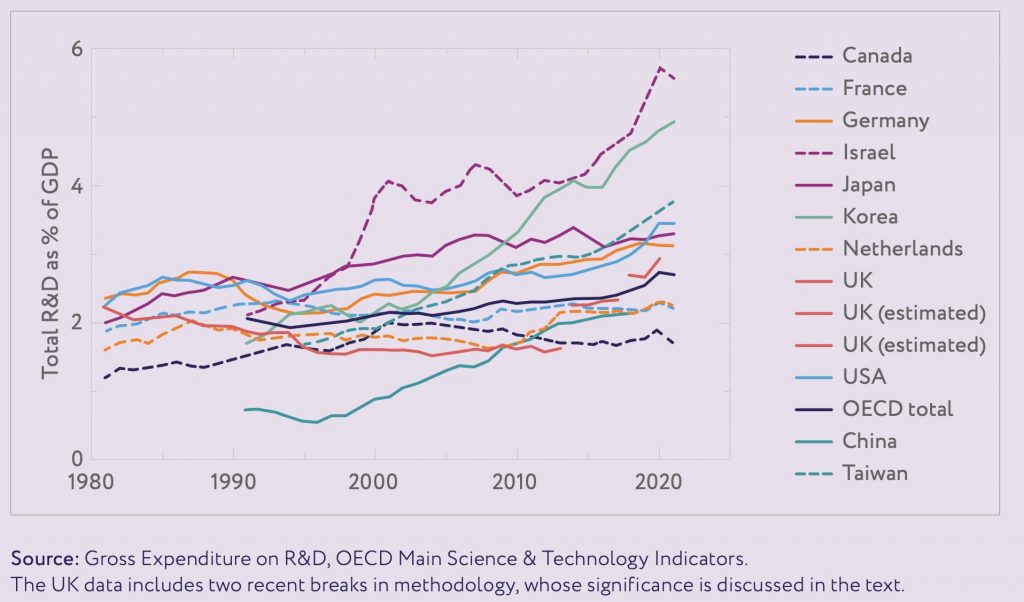
While the UK is barely mentioned in the book, we know from his other writing some of Wang’s views about it. In his 2020 letter, he stressed that China couldn’t follow the example of the UK, “which is so successful in the sounding-clever industries—television, journalism, finance, and universities—while seeing a falling share of R&D intensity and a global loss of standing among its largest firms.” He followed this up with this comment on Twitter [3].

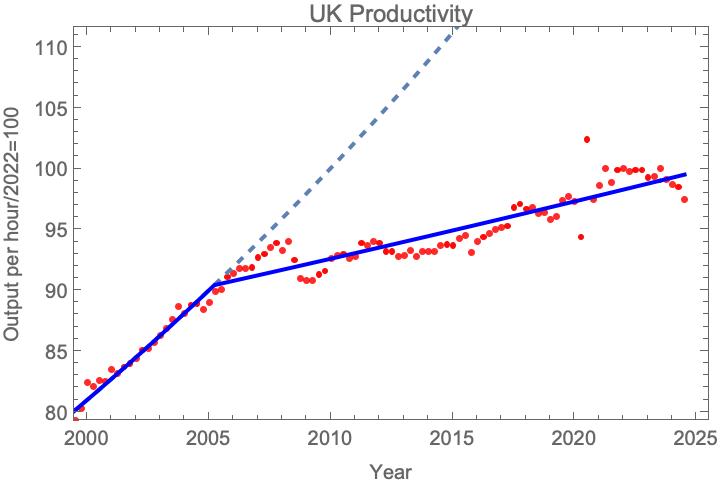
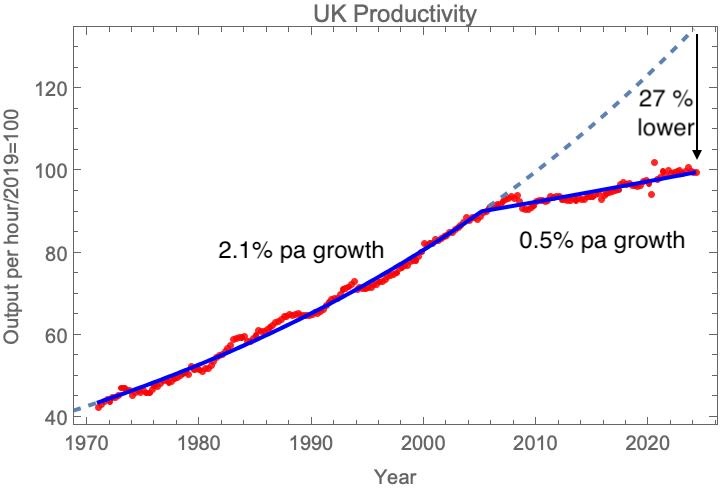
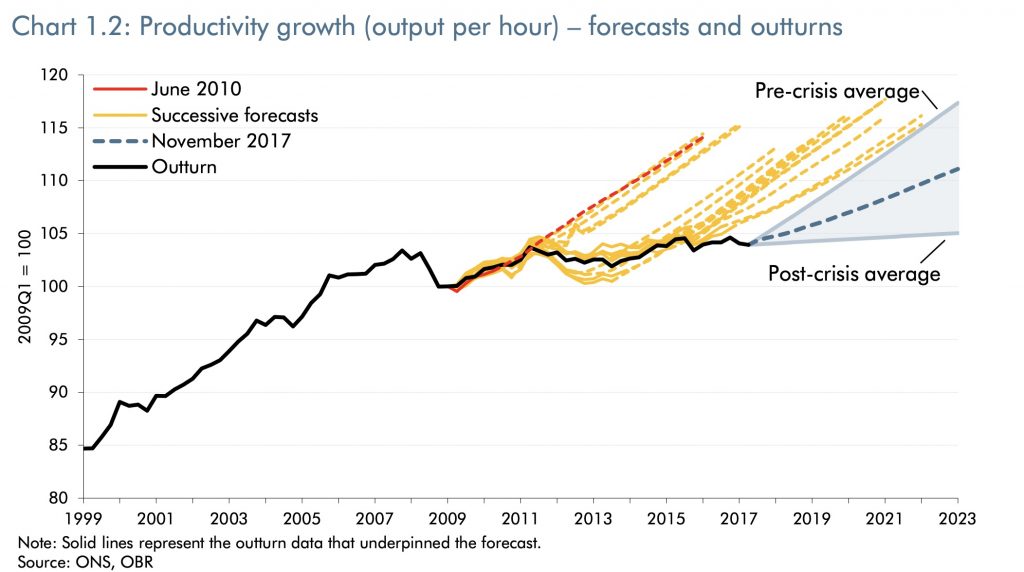
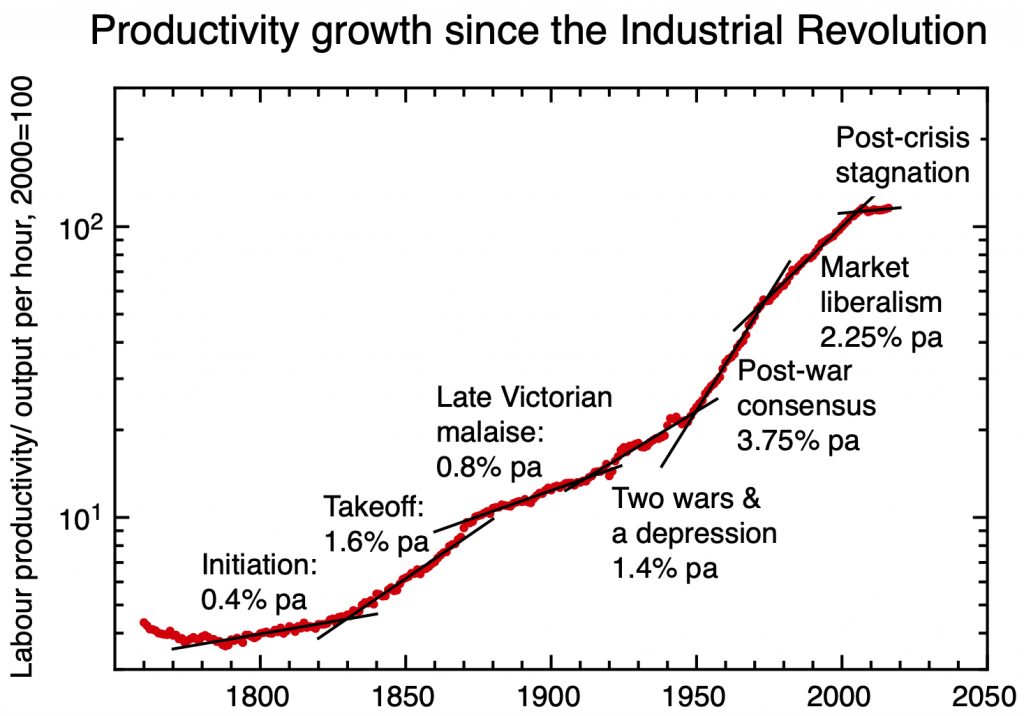
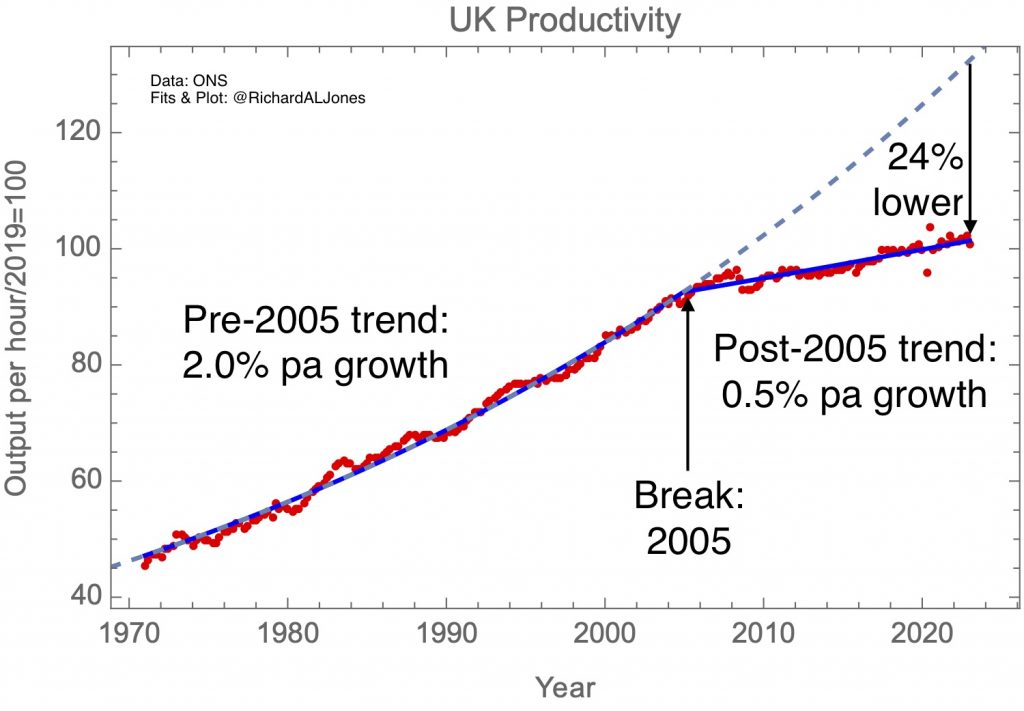
I don’t think the UK is a lawyerly society in the same way as the USA. It certainly suffers some parallel problems in its inability to build infrastructure, but its productivity slowdown and loss of high tech manufacturing has been even more marked. The lesson of the UK is that development isn’t always one way – countries can de-develop, losing technological capacity through a loss of process knowledge and the engineering communities of practise that sustain it.
Wang’s book ends with the hope that America can declare itself to be a developing country – “able to reform itself, get unstuck from the status quo, and ultimately unlock as much as possible of human potential.” I hope that every country can think this way.
Notes:
[1] A couple of other reviews of Breakneck that I found interesting:
Jonathon Sine
A nice interview with Dan Wang himself
[2] I’m reminded of a very apposite saying by the historian David Edgerton: “The UK is not a small USA, it is a big Canada”.
[3] So who are these British nay-sayers that so disloyally cheer Wang on in his denigration of the UK’s economic choices? Oh.