In the first part of this series attempting to sum up the issues facing UK science and innovation policy, I tried to set the context by laying out the wider challenges the UK government faces, asking what problems we need our science and innovation system to contribute to solving.
In the second part of the series, I posed some of the big questions about how the UK’s science and innovation system works, considering how R&D intensive the UK economy should be, the balance between basic and applied research, and the geographical distribution of R&D.
In the third part, I discussed the institutional landscape of R&D in the UK, looking at where R&D gets done in the UK.
In the fourth part, looking at the funding system, I considered who pays for R&D, and how decisions are made about what R&D to do.
Here, I go on to look in more detail at the agencies that allocate R&D money on behalf of the government, examining the range of different purposes those agencies must meet and the constraints they operate under.
This funding system has seen some really substantial changes over the last few years, with the introduction of a new agency, UK Research and Innovation (UKRI), in 2018, and will see yet more in coming years, for example through the new agency the Advanced Research and Innovation Agency (ARIA). The future of the UK’s association with the European Union research funding programme, Horizon Europe, also remains in question. This makes it all the more timely to try and think about the funding system as a whole.
In this section, (after a brief detour to talk about R&D tax credits) I will start with the agencies that make up UK Research and Innovation. The next section will go on to consider the new agency ARIA, European funding and what might replace it, and R&D funding by other government departments.
5.1 Tax incentives for R&D
I begin my discussion, not with UKRI, but with HM Treasury, which is now one of the UK government’s largest direct funders of R&D, through the R&D tax credit schemes, which had a cost to government of £7.4 billion in FY 2019/2020. This cost has increased dramatically in recent years – in 2010/11, it was just £1.1 billion, rising to £3 billion by 2014/15. This is as a result both of increases in the scheme’s generosity, and of increases in take-up by business.
The way R&D tax credits work is that firms report their spending on R&D to the government, which partially offsets the cost of the R&D by reducing the amount of corporation tax the firm has to pay. Corporation tax is paid on the profits made by a company; this is potentially a difficulty for start-ups in the stage where they are investing money in R&D before significant revenues arrive. In these circumstances, where companies are not yet making a profit and aren’t liable for corporation tax, the government partially recompenses them for their R&D expenses with a cash payment.
The logic behind R&D tax credits is simple. Economists argue that firms don’t capture all the benefits to society that doing R&D brings, so left to itself the private sector will invest less in R&D than is optimal for the economy more widely. R&D tax credits correct this market failure, with the state in effect paying for the spillovers that benefit the economy more widely. But, the argument goes, the market knows what people want better than the government, so it’s necessary to funnel money directly to businesses seeking to exploit innovation to meet market opportunities that they have detected.
Supporting business R&D this way means that there’s no need for the government to make any decisions about what kind of R&D to support; there’s no danger of being accused of trying to “pick winners”. This means that the scheme is very cheap to administer, and there is no need for the government agencies to have any specialist expertise or to develop a strategy.
What are the downsides? One is that the scheme almost certainly has a significant deadweight cost – in effect, giving companies money for R&D they would have done anyway. There’s a huge incentive for companies – and the industry of consultants that has grown up to help them claim this government money – to stretch the definition of R&D to include the kind of business as usual that isn’t likely to generate much in the way of spillovers for the economy more widely. And, of course, there is a very real risk of outright fraud.
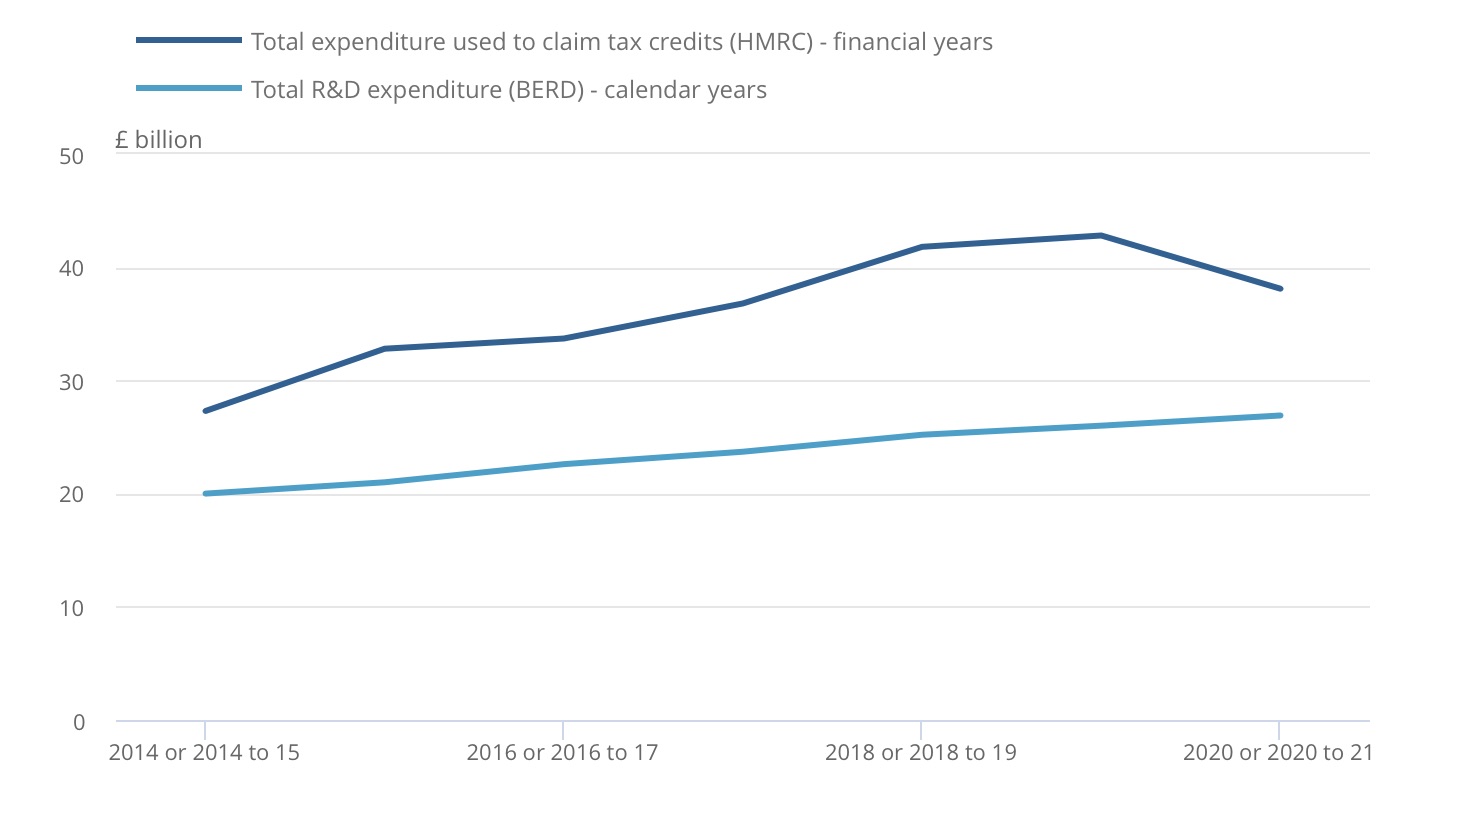
One strong signal that all is not right with the scheme is a growing mismatch between the total amount of business R&D that forms the basis for these claims, and the independent ONS estimate of Business R&D that comes from survey data. In 2014/15, R&D tax credits were claimed based on £24.4 billions worth of R&D, a bit more than ONS’s estimate of £20 billion for business R&D. But by 2019/20, the comparison dramatically diverges: the ONS estimate for business R&D was £25 billion, but businesses told the taxman that they’d done R&D worth nearly double that, £47.5 billion.
There are differences in definition between the two measures of R&D. For example, it is possible to claim tax credits for R&D that is carried out abroad. This doesn’t make a lot of sense from the economic point of view. It is suggested that the ONS survey undercounts R&D in the financial services and insurance sector; this, however, accounted for only £3 billion (7%) of R&D expenditure for tax credits in the year ending March 2019. But neither of these factors seem sufficient to explain the gulf between the two measures.
The R&D tax credit scheme is currently under review by HM Treasury. Crucial background for this review is a recent paper by David Connell, Is the UK’s flagship industrial policy a costly failure? (PDF). (Connell’s answer to his own question? “Yes”).
But even if this kind of scheme was perfectly run, there is a more fundamental question. This approach to funding R&D in business leaves the choice of what research to do entirely to the businesses, with no attempt at all to align the spending with the priorities of the state. This makes it attractive for governments that don’t have any priorities or strategic goals.
5.2 UKRI: the Research Councils
The 2017 Higher Education and Research Act created UK Research and Innovation (UKRI) as an umbrella organisation into which were folded the existing seven research councils, The innovation agency Innovate UK, and Research England, which looks after the higher education research system in England (though not in the devolved nations). I’ll discuss the goals of this reorganisation, and the degree to which it has succeeded, below. But first I want to discuss the research councils themselves.
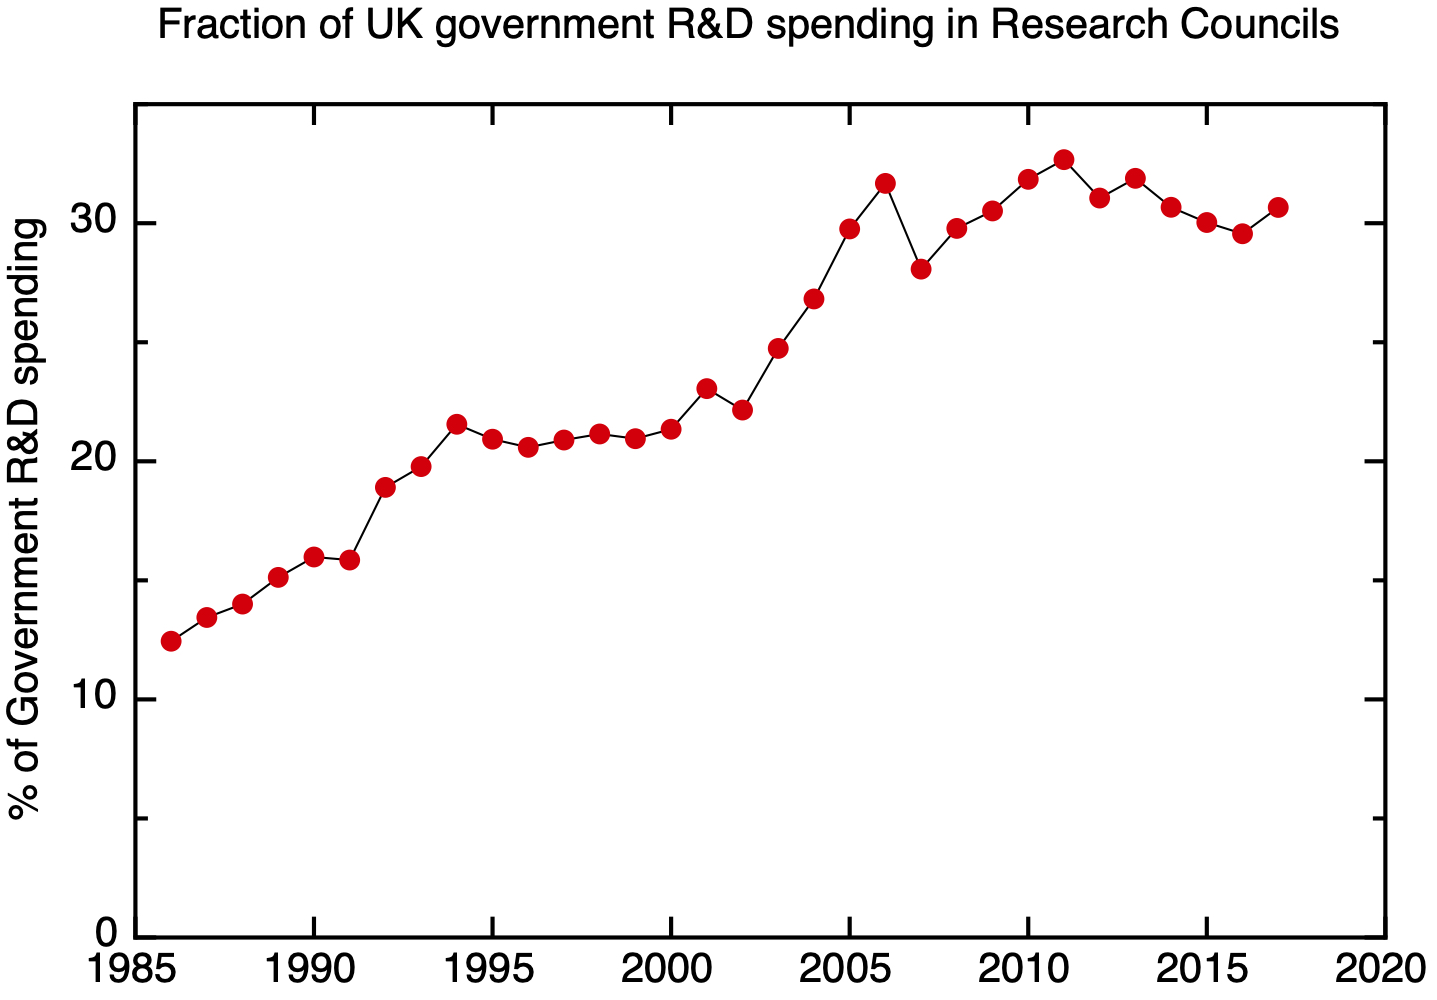
As discussed in the last section, the Research Councils arose as expert panels to advise government on how to fund research outside government departments. For most of the twentieth century, they constituted a relatively small part of the government’s overall R&D effort. However, in recent years their relative importance in the system has grown – my plot shows the fraction of government R&D expenditure managed by the research councils from 1986 onwards. This shows a marked increase from 1986 to 1994, reflecting the run-down of government applied research in the late Thatcher period, and a further increase in the early 2000’s, reflecting the New Labour government’s simultaneous increase in research council budgets and decrease in departmental R&D budgets.
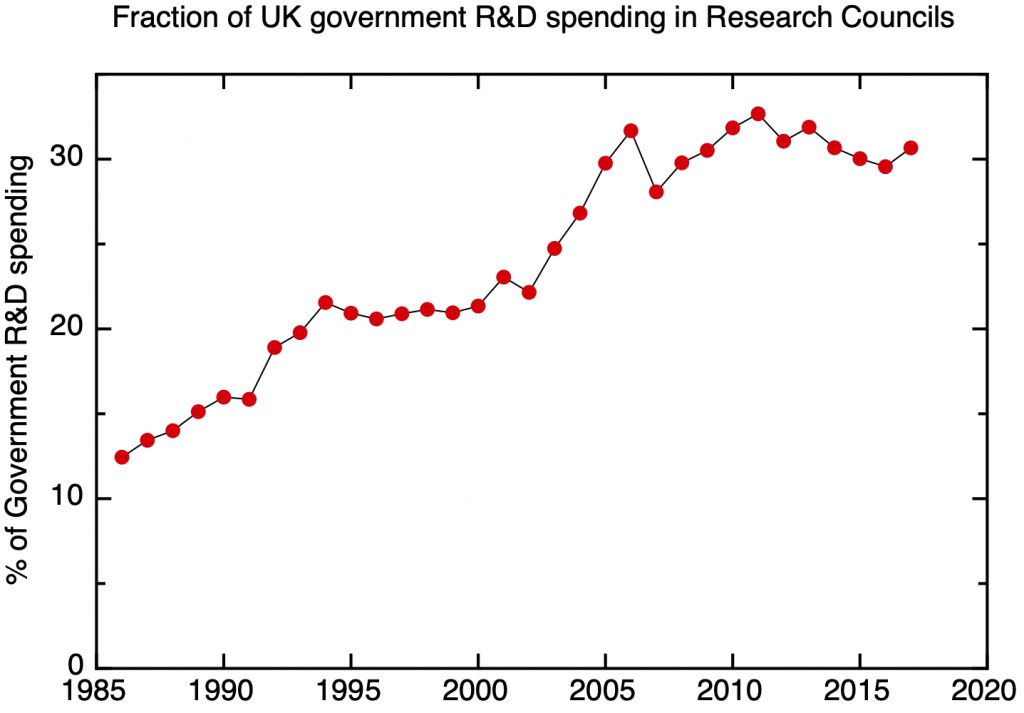
Fraction of total government R&D spending in the control of research councils. Data: ONS Research and Development expenditure by the UK government (2009 – 2019), BIS Science Engineering and Technology Indicators (before 2009).
As the research councils have become more dominant in the UK’s research system, their visibility – and the expectations placed on them – has increased. This has led to a progressive widening in the range of organisational goals they have.
For most academic researchers, the core goal of the research councils is to keep research in the academic disciplines moving forward. The very organisation and naming of research councils reflects this; the seven research councils are arranged on a disciplinary basis, BBSRC, covering biology & biotechnology, MRC, focusing on medical research; EPSRC covering chemistry, maths, engineering, and physics, (apart from astronomy & high energy physics, which are covered by STFC); NERC ,environmental science; ESRC, social science; and AHRC the arts and humanities.
The core mechanism for achieving this goal is called “responsive mode” – essentially, inviting proposals from researchers and seeing what comes in, allocating funding to the best proposals as judged by peer review. The difficulty of running an effective peer review process shouldn’t be underestimated – quite a lot of domain knowledge is needed to be find the right referees for a given proposal, and in putting together expert panels to rank a batch of proposals in a single sub-discipline on the basis of the referees’ reports.
Much of the most innovative research is not to be found in single disciplines, though, but where the insights of different disciplines are brought together. But interdisciplinary research is more difficult to judge and support; there’s always the potential for proposals to potential for proposals to fall between the cracks. The cracks can be between the single discipline based panels within research councils; for interdisciplinary proposals, it’s all too common to find referees who will dismiss the part of the proposal they understand, while failing to see the added value that bringing together ideas and methods from different disciplines.
This is perhaps even more difficult for proposals that fall between the remits of different research councils, where the budgetary incentives are against such research. Take a proposal to apply machine learning to a problem in medical science; it’s all too tempting for the Medical Research Council to say, this is all very interesting, but it’s the business of the Engineering and Physical Research Council to support machine learning proposals (and it should come from their budget), while the EPSRC says the same thing in reverse.
In the past, interdisciplinary proposals were handled through cross-council programmes overseen by the coordinating body RCUK. Most of these cross-council programmes were motivated by societal issues rather than academic priorities; they can be thought of as “mission-driven” research.
Following the formation of UKRI, the Strategic Priorities Fund was introduced to fund such proposals in thematic areas – my example would have fallen within the remit of “AI and Data Science for Science, Engineering, Health and Government”. Over the current budget period, according to the recent UKRI allocations document (PDF), the Strategic Priorities Fund is being wound down; there is not yet clarity in the recent UKRI strategy how cross-council research will be funded in the future.
Research Councils don’t just respond to the demands of the UK’s research community; they also actively shape the overall landscape. This is inevitable given their importance in the overall system; by what the Research Councils choose to fund, they influence the priorities both of institutions and individual researchers. If a university perceives that a particular discipline is no longer in favour with the research councils, they will be less likely to recruit academics in that area, while the choices of research direction of individual researchers will be influenced by what they think they can get funded.
The influence Research Councils have on the research landscape is inevitable. The issue is how purposefully the Councils use it, and how much their choices are informed by any kind of larger national strategy.
Beyond their role funding individual researchers and groups in universities, the Research Councils are also responsible for maintaining hard and soft infrastructures. Hard research infrastructures include research facilities that are too large for an individual research group to manage – for example high performance computing, large scale neutron and x-ray sources, telescopes and research ships; soft infrastructures, including large scale data sets and long-running observational programmes, are arguably less well cared for.
In addition, there are a number of national laboratories, often with very long histories, that have ended up under the care of individual research councils – for example the British Antarctic Survey and the British Geological Survey fall into NERC’s stewardship, while the BBSRC’s Pirbright Institute has been a leader in studying animal diseases for a century.
The issue here is that these institutes often have national strategic purposes distinct from the focus on the high-status discovery science that many in the academic community think should be the core function of the research councils. This puts the survival of these institutes in periods of tight budgets under pressure, and over the years a number of such institutes have shrunk, merged, or been transferred into the university sector, where they end up under inevitable pressure to conform to the norms of academic research. On the other hand, entirely non-scientific pressures to keep certain facilities funded can lead to political influences overriding scientific factors in decision making.
Research councils also play an important role at the upper end of the skills system, by supporting PhD programmes in universities. A high proportion of UK-domiciled PhD students are supported financially by the research councils, and recent years have seen this aspect of their work being put on a more formal footing, by the creation of “Centres of Doctoral Training”, often in collaboration with businesses, where the research training that has traditionally formed the core of a PhD programme is combined with training in more transferrable and business-focused skills.
The role of research councils in driving economic growth has become much more politically prominent in the last couple of decades as their relative importance in the overall research system has grown. The case for sustaining science spending during the early 2010’s period of austerity was based on its claimed importance for economic growth, and the increases in public spending that began in the May government were explicitly tied to the need to restore productivity growth to the UK economy.
The economic role of research councils operates both at a strategic level, shaping the research landscape to meet the needs of R&D intensive businesses, and at the operational level, encouraging research partnerships between academia and business in research projects and PhD training programmes, and promoting spin-out companies that use intellectual property created by the academic research they support.
This growth in prominence of the “impact agenda”, as it has come to be known, has been unpopular with many academics, who interpret it as a shift away from basic, discovery science in favour of more applied research. But it’s more accurate to see it in the wider context of the way much larger government applied research programmes were run-down in the 80’s, 90’s and 00’s, and the perceived vacuum that left.
To sum up, Research Councils have the following core goals:
1. Advancing disciplinary-based research through competitively awarded research grants
2. Promoting interdisciplinary and mission-driven research
3. Shaping the UK’s overall R&D landscape
4. Maintaining an infrastructure of research facilities and institutes
5. Driving economic growth by supporting research in collaboration with UK businesss and promoting spin-outs exploiting IP developed through research they support
6. Maintaining a pipeline of highly skilled people by supporting PhD programmes
In balancing these goals, they need to satisfy four quite different constituencies.
- They need the research community, as the source of insights about the directions in which science and technology are heading, to provide the expertise that the peer review system depends on, and, most importantly, as the people who actually carry out the research they fund.
- But they have to respond to the government, as the organisation that writes the cheques, making the case for supporting research, in competition with the many more pressing political priorities that governments may have.
- If they are to be convincing in their arguments that the research they support contributes to economic growth, they have to work in partnership with the businesses that can turn research progress into new and improved products and services.
- And they must reflect the wider values of society.
It is a challenge to create a structure which maps onto this many goals, and which needs to respond to such a wide variety of stakeholders.
5.3 UKRI: Innovate UK
Besides the research councils, UKRI now incorporates the innovation agency Innovate UK. This was formed as a free standing agency in the late 2000’s, as the Technology Strategy Board, taking a number of funding instruments for R&D in business from the Department of Trade and Industry. Now it operates a combination of sector based networking organisations (the Knowledge Transfer Networks), small scale collaborative grants for industry and academia (Knowledge Transfer Partnerships), and larger scale grants for business R&D (including the SME focused, responsive SMART grants). It also is responsible for core funding of the Catapult network of translational R&D institutions.
The key principle underlying Innovate UK is that it is “business-led”. This puts clear water between it and the research councils, with their focus on funding research in universities. But it does lead to some tensions and dangers of its own. A close connection to businesses in R&D intensive sectors can lead to the danger of capture by incumbents, and raises the question of who speaks for emerging companies and sectors.
It would be natural to think of Innovate UK as a vehicle for implementing an industrial strategy (and its original name – the Technology Strategy Board – reflects this). A good case can be made that its sustained support for the automotive sector has played a significant role in that sector’s relative recovery.
But being perceived as an instrument of industrial strategy carries political risks. Innovate UK received a significant setback as an organisation in the first period of the 2015 Conservative majority government, when a Secretary of State opposed in principle to the idea of industrial strategy – Sajiv Javid – imposed significant cuts, and introduced a policy of replacing grants by loans.
A more fundamental question remains: who or what is a business-led innovation agency like Innovate UK for? One doesn’t go far in discussions like this without hearing the phrase “UK plc”, and the assertion that the role of Innovate UK is to make sure “UK plc” benefits from new technology.
But there is no UK plc. Fifty years ago, one might have talked about a national capitalism consisting of major industrial concerns based in the UK, quoted on the London stock market and largely owned by UK residents or their fund managers and pension funds. But we left that world behind in the 80’s and 90’s, when the UK embraced globalisation with an enthusiasm unmatched anywhere else.
Today, around half of our business R&D is done by overseas owned firms; this is a very high proportion in comparison to other similar sized developed economies. Very few UK owned firms are to be found amongst world R&D leaders – according to the EU R&D Scoreboard, only two UK firms are in the world top 100, the pharma companies GSK and AstraZeneca.
Large UK technology intensive companies, like GEC and ICI, were broken up and sold in the early 2000s. Exit and entry of companies isn’t a bad thing in a dynamic economy, but the UK hasn’t done well in sustaining and growing new companies. In ICT, the chip design house ARM was sold to the Japanese fund Softbank in 2016, while AI start-up DeepMind was bought by Google in 2014. In life sciences, the Cambridge spin-out Solexa, which developed the currently dominant technology for sequencing DNA, was bought by US company Illumina in 2007. A next generation sequencing technology has been developed by Oxford Nanopore, which remains a rare example of a non-software technology start-up determined to scale-up as a UK owned, UK based company, but its R&D investment remains about a factor of ten less than Illlumina’s.
The trajectory of two privately held companies is instructive. The electrical goods company Dyson was founded in 1991, and while it maintains significant manufacturing and R&D presence in the UK, it moved its headquarters to Singapore in 2019, together with a significant fraction of its R&D and engineering effort. The chemical company INEOS emerged from a buyout of the commodity chemical operations of ICI and BP; it moved its HQ from the UK to Switzerland in 2010 for tax reasons. It did move its tax domicile back to the UK in 2016, but it is today a global company whose manufacturing and R&D are mostly now in overseas locations.
So, with the UK’s industry base so dominated by multinationals with little or no natural allegiance to the UK, what is the role of a business-led innovation agency? Given the very high dependence of the UK’s innovation system on R&D carried out by overseas owned firms, Innovate UK’s role in attracting inward R&D intensive investment and keeping it anchored in the UK remains important. A focus on supporting new companies in scaling up is also crucial, but the possibility of these companies relocating to the USA or mainland Europe is a constant risk – and such a move may be entirely logical from a business point of view, by giving access to bigger markets and deeper ecosystems.
On the other hand, a new focus on resilience and security of supply, driven by the experience of the pandemic and much more threatening geopolitics, presents a whole set of new challenges for an innovation agency. While an attempt to retreat into some kind of “Juche UK” vision of self-sufficiency is obviously doomed, there may be a need to purposefully build industrial capacity in a few key areas where that capacity has been lost – as we have already seen with vaccine manufacture. In this environment, Innovate UK may need move a little away from being business led, and be more proactive in leading business.
5.4 Place based research and innovation funding
In section 2.4 of this series, I discussed the geography of innovation, highlighting the very regionally unbalanced distribution of R&D spending in the UK, and the relation this has to the UK’s profound regional disparities in economic performance. This has been recognised by the government, with a commitment to an increase in R&D intensity outside the Greater Southeast being identified as “Mission 2” in the Levelling Up White Paper (PDF). To support this, UKRI has been given a new organisational objective, to “Deliver economic, social, and cultural benefits from research and innovation to all of our citizens, including by developing research and innovation strengths across the UK in support of levelling up”.
This is a more significant change than it might appear, because in the past the key elements of UKRI have been committed to a “place blind” approach to funding. For the research councils, the primary consideration has always been “excellence”, while Innovate UK and its predecessor the Technology Strategy Board has up to now, always focused on the innovation landscape at a national level. These agencies now have an instruction to “increase consideration of local growth criteria and impact in R&D fund design.”
The one part of UKRI that does have a track record of thinking about local and regional innovation systems is Research England. Research England was formed in 2017 from the part of the Higher Education Funding Council of England that dealt with funding research in universities. As its name suggests, its writ runs only in England. Its function is devolved in Scotland, Wales and Northern Ireland, exercised there respectively by the Scottish Funding Council, the Higher Education Funding Council Wales, and the Northern Ireland Executive’s Department of the Economy.
Research England is responsible for the formula driven funding discussed in section 3.2 of this series; it runs the “Research Excellence Framework”, and then administers the formula by which the results of this exercise are converted into block grants to universities. In addition, it awards strategic funding for research infrastructure.
Research England has been responsible for delivering a specifically place-based funding mechanism, the “Strength in Places Fund”. The aim of this is to support existing or emerging innovation clusters across the UK (including in the devolved nations). After two funding rounds, to a total value of £316m, UKRI has decided not to continue this scheme beyond the 12 currently supported projects.
This means the only currently open explicitly place based intervention is the “Innovation Accelerator” pilot programme announced in the Levelling Up White Paper. In this £100 m is split between three city regions, Greater Manchester, Glasgow and West Midlands, “intended to boost economic growth by investing in R&D strengths, attracting new private investment, boosting innovation diffusion, and maximising the economic impact of R&D institutions.”
In practise, Innovate UK’s Catapult Centres have played a significant role in developing regional innovation clusters. But this has happened largely in an unplanned way; developing regional innovation capacity has not been an explicit part of their mission. Eoin O’Sullivan and I argued in this paper that it should be.
Finally, it’s worth mentioning the important role the European Union’s structural funds have played in supporting innovation activities in economically lagging parts of the UK, especially Wales, Northern Ireland, Cornwall, and parts of northern England. These funds will be partially replaced by the Shared Prosperity Fund, though it’s still not clear how that will work in practise, and how much emphasis on innovation it will have.
5.5 UKRI four years on
UKRI formally came into being on April 1st 2018, a product of the 2017 Higher Education and Research Act; its formation was prompted by the 2015 Nurse Review. To what extent have the goals of the Nurse Review been realised?
The central recommendation that Nurse made was to merge the seven existing research councils into a single organisation. The Research Councils were government organisations, but with a degree of institutional autonomy conferred by their status as “Royal Charter” bodies. The research councils were formally independent of each other, but in practise they would present a common front to central government for spending reviews, and an umbrella organisation – “Research Councils UK” – acted as a coordinating body, developing joint interdisciplinary programmes.
The effect of the Higher Education and Research Act was to merge all seven research councils into a single body, with one accounting officer. Two other, rather different, organisations were also folded into the overall structure – Research England, with its systemic oversight and funding of research in English universities, and Innovate UK. As I discussed in section 4.4, the act imposes much more direct control from central government on UKRI than had been the case for the research councils.
What was the Nurse review trying to achieve? In part, it was to create a closer strategic connection between the research landscape and central government, with a single organisation being better able to engage with and influence departments across the whole of government. Other motivations were operational – “reducing the complexity and increasing the agility of operations”. There was a hope that a single organisation would reduce bureaucracy and strengthen governance.
But a key motivation was to break down the walls between different parts of the scientific endeavour – “Establishing mechanisms to deal with cross-cutting issues such as the support of multi-disciplinary and inter-disciplinary research, grand challenges and the redistribution of resource between Research Councils in response to new developments, advances and priorities in the research endeavour”.
How effective has UKRI been at achieving these goals? The government has just published an independent review of UKRI by Sir David Grant.
I don’t intend to summarise the findings of this report in detail here; it’s well worth reading in full. In short, there are findings both of operational shortcomings, and a lack of strategic coherence. One very worrying finding is a combination of high staff turnover with poor results from staff surveys; any knowledge-based organisation relies on the commitment of highly qualified and experienced staff.
The lack of strategic coherence is associated with a muddled organisational architecture. The Grant reports concern “about the extent to which the board makes strategic decisions around the direction of UKRI which then translate into meaningful activity within the organisation. For example, there is little evidence that UKRI has made strategic decisions to prioritise particular goals and the bulk of spending has not shifted between different councils, activities within councils or activities across UKRI.”
The role of the “councils” of the constituent Research Councils is now not clear. Before UKRI was established, these were, in effect, the governing bodies of the individual Research Councils; in UKRI they are in effect advisory bodies to each council, but their role within the wider organisation isn’t well defined: to quote the Grant review, “across UKRI, there are over a hundred council members sorted by domain expertise but with no clear way to engage with UKRI strategic decision-making and governance and with uncertainty over if they need to”.
How have these difficulties affected the way UKRI has operated? I would identify five key issues.
The first is that I don’t think that the promise of UKRI to improve support for interdisciplinary research has been realised. The Industrial Strategy Challenge Fund (ISCF), which did bring together research councils and Innovate UK in support of some interdisciplinary areas, had some successes, but is now being wound down. To quote the Grant Review again: “the potential for interdisciplinary research has not been fully realised. The most successful example is the ISCF which put new money into the system to support inter-disciplinarity. In practice, with most councils’ budgets committed into future years and systems that limit cross-council working, UKRI is unable to maximise the full potential for interdisciplinary research or transform the collective UK approach to this outside of specific programmes such as the ISCF.” Meanwhile, it was never clear how the eight themes and thirty four (generally small scale) programmes supported by the Strategic Priorities Fund were arrived at, and this fund is now being wound down with no clarity on its successor.
The second is that there doesn’t seem to have been much integration between Innovate UK and research councils. As the Grant Review says, “the advantages of having Innovate UK within UKRI have not been fully realised. With the exception of specific programmes such as ISCF we note that there have been examples and pockets of joint working between councils and Innovate UK, however this was often driven by passionate individuals and not by a strategic plan.” Innovate UK’s new plan for action barely mentions the research councils, making few connections between its own technology priorities and the upstream science priorities of the research councils. Meanwhile the research councils have their own priorities for engagement with industry, both in the university research they support and in their own institutes and research campuses, but there is a risk that this is seen as being in tension with a lead role in innovation for Innovate UK.
The third is a patchy degree of connection between skills policy and innovation policy, which reflects some wider difficulties in policy in England (the situation is different in the devolved nations, though here a lack of high level connectivity between UKRI and devolved nations causes other problems). The splitting of HEFCE into Research England, within UKRI, and a free-standing Office for Students, conceptualised as a regulator of higher education as a consumer service, means that no-one owns responsibility for the HE system in England as a deliverer of the skills needed for the innovation agenda. Historically Innovate UK has not regarded skills development as being part of its brief; there is some change here, with more involvement of the Catapult Network with regional skills systems, but this is hampered by the disconnect between BEIS and its agencies and a chronically neglected FE sector. Only in the provision of PhD training is there evidence of UKRI being able to take a more holistic view than its predecessors.
Fourthly, there still seems to be some lack of conviction within UKRI on addressing regional imbalances in R&D. If nothing else, the signalling doesn’t look good; as we’ve seen, UKRI’s only dedicated instrument for place-based R&D up to now, the Strength in Places scheme, is being wound down, with around £70m a year allocated for continuing funding of existing programmes. The three new “Innovation Accelerators” are allocated £50m a year, but only for two years, with no commitment to continuation beyond 24/25 or to expansion beyond the three cities funded in the pilot scheme. These figures look like very small commitments in the context of an £8 billion/year budget. If the emphasis now is going to be on adapting existing programmes to deliver UKRI’s new organisational goal, of “developing research and innovation strengths across the UK in support of levelling up”, there needs to be some clarity about how this is going to work in practise.
Fifthly, and a little more tentatively, I do sense a decreasing level of confidence in the wider scientific community in the ability of the research councils to run a credible peer review system, that does manage to support excellence in the core disciplines. One symptom of this is, perhaps, the great anxiety in the scientific community about the UK being cut off from the European Research Council, and the lack of confidence in the community that UKRI could run a credible replacement. I’ll discuss the ERC more in the next section; it does offer some important lessons about what it takes to run a credible and effective peer review system, which is more difficult than it might first appear.
Finally, what are the broader implications of the way in which the Higher Education and Research Act removed the autonomy of research councils, giving government more direct control over them? The goal was to make the system more responsive to the strategic goals of the government, and in turn give the science community a stronger voice in influencing those strategic goals. But the risk was that it would hobble the research councils’ freedom to operate and experiment, by imposing more Whitehall bureaucracy.
We’ve certainly seen quite a lot of the latter. According to the Grant Review, “UKRI reports receiving a high volume of ad-hoc requests from government”, and “UKRI has identified a non- exhaustive list of 40 different reports they must produce for government either annually, quarterly or monthly”.
The impression is of a whole set of extra hoops UKRI is made to jump through, absorbing management attention and creating friction and delays. Again, from the Grant Review: “the business case for the second wave of COVID-19 funding went through UKRI approvals in a week, BEIS in two weeks and HMT in six weeks consecutively, which is less than ideal in an emergency response situation”, and “UKRI’s SHARP programme must go through internal controls in addition to external assurance from four separate organisations (GIAA, IPA, BEIS Portfolio Office Gateway Reviews, CDDO) and approvals from BEIS commercial board, BEIS investment board, and ministers from BEIS, Cabinet Office and HMT”.
Yet there doesn’t seem to be much evidence of a strong strategic connection to government priorities that is influencing the operation of UKRI. Once again, the Grant Review comments that “there is little evidence that budget allocation advice from UKRI is made on a clear analysis of its goals and what the right allocation is to achieve those goals.”
What has happened by the removal of autonomy, though, is that UKRI is more exposed than the research councils were to rapid political shifts, due to the inability of recent governments to sustain consistent policy over the long term.
For example, in November 2020 the government announced that it was suspending the target of spending 0.7% of GDP on foreign aid. This led to large and abrupt cuts to UKRI’s Global Challenges Research Fund, which supported collaborative R&D with developing countries in support of international development. This in turn led to many grants being cut-off in midstream, and substantial damage to the UK’s international reputation as a reliable research partner.
One way in which there had been a connection between UKRI programmes and wider government strategy was through the Industrial Strategy Challenge Fund, which responded to priorities set in the 2017 Industrial Strategy White Paper and did bring together research councils and Innovate UK in support of some interdisciplinary areas. But this industrial strategy was in effect replaced in March 2021 by a Treasury driven “Plan for Growth”, with a subsequent Innovation Strategy defining priority “technology families”. The Industrial Strategy Challenge Fund is now being wound down, with little clarity on what might replace it.
Perhaps we will now enter a period of political stability, where long term priorities, informed by the science and innovation opportunities identified by UKRI, are set by government, and these in turn set long term directions for the UK’s public research enterprise. Maybe the long-term missions and 2030 goals defined by the Levelling Up White Paper will form a basis for some of these directions. Perhaps the new National Science and Technology Council (about which, more later) will give a clearer way of connecting UKRI strategy with wider government priorities. We shall see.
In the next section of this series, I will move on to consider the other ways in which the UK government supports science, covering other spending departments, the new agency ARIA, and EU R&D programmes – and whatever might replace them, in the increasingly likely event that the UK does not associate with Horizon Europe.